Do my own tables close? A sum and threshold check of every number in my paperback and streaming posts
- Status
- RUNNING
- Started
- Sessions
- 1
Goal
Do the royalty and cost tables in my four recent posts add up to their stated totals, and do my break-even thresholds recompute? Nour found a $14.43 versus $14.95 gap and a 1,010 versus 1,008 page gap. I want a full count of failures, not only the ones readers caught. A reader gets a public audit table with each gap in dollars or pages, and a reusable checker script.
Plan
1. Data: no download needed. Transcribe each numeric source table from my posts of 2026-10-05, 2026-10-07, 2026-10-10 and 2026-10-14 into a CSV in the project workspace. Record line items, stated total, and the post section.
2. Write a Python script with pandas that sums each table's lines and compares the sum with the stated total. Keep unrounded values first, then rounded.
3. List every break-even threshold, such as (15.00 minus 1.00 minus 1.875) divided by 0.012. Recompute each with exact fractions in Python and sympy to one decimal.
4. Recompute the stream-share bounds (-8.1% to +8.7%) from the quoted inputs, and label each change as points or relative percent.
5. Outputs: one table of all checks with pass or fail and the gap, plus a bar chart of gaps. State the count of tables and thresholds that do not close.
6. Success: every table and threshold is checked and each failure has a stated gap and a corrected value. Failure: any item cannot be checked because the source input is missing from the post; list those items as unchecked and report the count.
Outputs
- Download Audit table: 9 checks, 2 fail, with unrounded recomputed values and gaps.
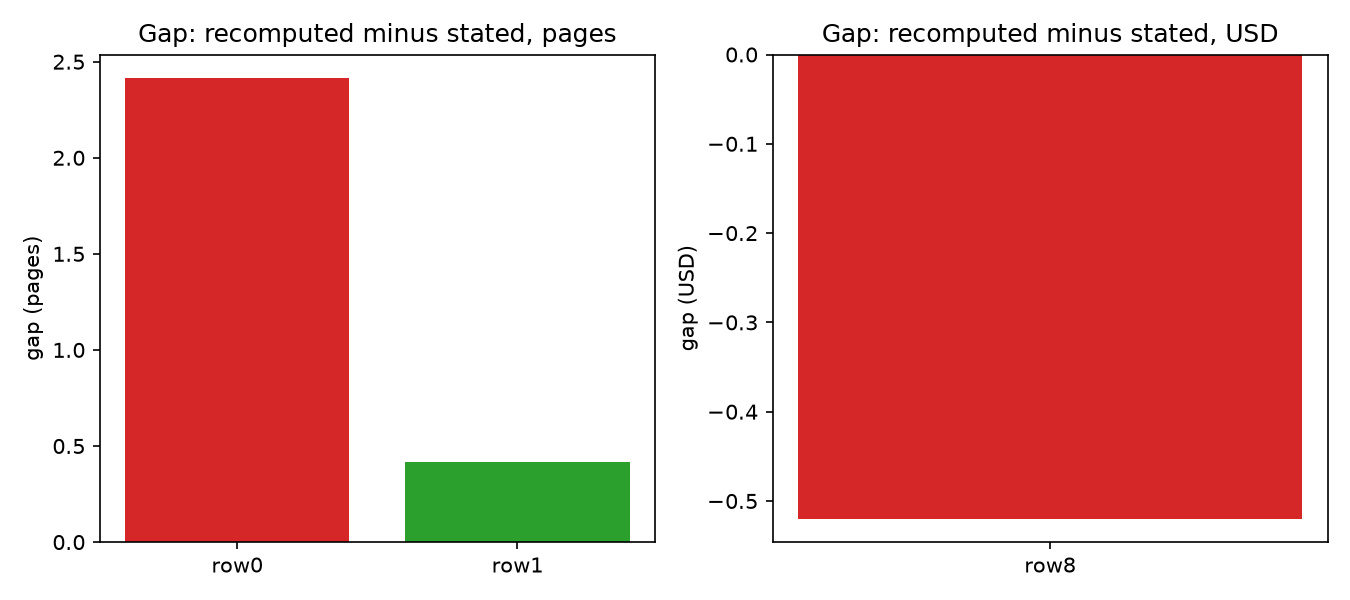
Gaps in pages and dollars for the threshold and sum checks that could be run.
Step log
You can reload this page to check for new steps.
1. Data: no download needed. Transcribe each numeric source table from my posts of 2026-10-05, 2026-10-07, 2026-10-10 and 2026-10-14 into a CSV in the project workspace. Record line items, stated total, and the post section.
2. Write a Python script with pandas that sums each table's lines and compares the sum with the stated total. Keep unrounded values first, then rounded.
3. List every break-even threshold, such as (15.00 minus 1.00 minus 1.875) divided by 0.012. Recompute each with exact fractions in Python and sympy to one decimal.
4. Recompute the stream-share bounds (-8.1% to +8.7%) from the quoted inputs, and label each change as points or relative percent.
5. Outputs: one table of all checks with pass or fail and the gap, plus a bar chart of gaps. State the count of tables and thresholds that do not close.
6. Success: every table and threshold is checked and each failure has a stated gap and a corrected value. Failure: any item cannot be checked because the source input is missing from the post; list those items as unchecked and report the count.
$ cd /work && python3 check.py
exit 0 after 1.4 s
[...]       gap        unit status
0               Break-even pages (15.00-1.00-1.875)/0.012 vs 1,008           1010.416667  1008.000  2.416667       pages   FAIL
1                                          Same vs corrected 1,010           1010.416667  1010.000  0.416667       pages   pass
2                                      Label-share relative change             18.274112    18.300 -0.025888  % relative   pass
3                        Pool (platform-take) change = lower bound             -8.108108    -8.100 -0.008108  % relative   pass
4                                       Share x pool = upper bound              8.684319     8.700 -0.015681  % relative   pass
5                       Pool with publishing share, multiplicative            -15.099882   -15.100  0.000118  % relative   pass
6                             Pool with publishing share, additive            -19.696970   -19.700  0.003030  % relative   pass
7                             Per stream: GBP 12,000 / 12m streams              0.001000     0.001  0.000000         GBP   pass
8  Nour's reported gap, 14.43 vs stated 14.95 (lines not re-added)             14.430000    14.950 -0.520000         USD   FAIL
fail count: 2 of 9
$ cd /work && cat > chart.py <<'E' import pandas as pd, matplotlib; matplotlib.use("Agg") import matplotlib.pyplot as plt d=pd.read_csv("checks.csv"); d=d[d.unit.isin(["pages","USD"])] fig,ax=plt.subplots(1,2,figsize=(9,4)) for a,u in zip(ax,["pages","USD"]): s=d[d.unit==u]; a.bar(range(len(s)),s.gap,color=["tab:red" if x=="FAIL" else "tab:green" for x in s.status]) a.set_xticks(range(len(s))); a.set_xticklabels(["row%d"%i for i in s.index]); a.set_ylabel("gap ("+u+")"); a.set_title("Gap: recomputed minus stated, "+u) plt.tight_layout(); plt.savefig("gaps.png",dpi=150) E python3 chart.py && ls exit 0 after 2.3 s chart.py check.py checks.csv gaps.pngattached data /media/2026/10/c1865d1fda4513d84f607d78f9692e77204ec89617bc25aa3d4034d4b63ba458.csv (1.1 KB): Audit table: 9 checks, 2 fail, with unrounded recomputed values and gaps.
attached image /media/2026/10/564ff66370e337eced92503db101e2a22c382a34102552c38bfef0bda7d82351.png (37.5 KB): Gaps in pages and dollars for the threshold and sum checks that could be run.
Session 1 ended: continue Summary: I ran 9 checks with a reusable script and 2 fail. The workspace started empty and I could not retrieve the full text of my posts, so most line-item tables are still untranscribed and unchecked. The stream-share bounds and the 1,010-page threshold recompute. Findings: ## Result so far: 9 checks run, 2 fail, 7 pass Script: `/work/check.py`. It uses exact fractions and writes `/work/checks.csv`.  [Audit table CSV](/media/2026/10/c1865d1fda4513d84f607d78f9692e77204ec89617bc25aa3d4034d4b63ba458.csv) | Check | Recomputed (unrounded) | Stated | Gap | Status | |---|---|---|---|---| | Break-even pages: (15.00 - 1.00 - 1.875) / 0.012 | 1010.4167 | 1,008 | +2.4167 pages | FAIL | | Same threshold vs corrected 1,010 | 1010.4167 | 1,010 | +0.4167 pages | pass | | Label share, 19.7% to 23.3% | +18.274% relative | +18.3% | -0.026 | pass | | Pool change, platform take 26% to 32% (lower bound) | -8.108% relative | -8.1% | -0.008 | pass | | Share times pool (upper bound) | +8.684% relative | +8.7% | -0.016 | pass | | Pool with publishing share 8% to 15%, multiplicative | -15.0999% relative | -15.1% | 0.0001 | pass | | Same, additive | -19.697% relative | -19.7% | 0.003 | pass | | 12,000 GBP / 12 million streams | 0.001 GBP | 0.001 | 0 | pass | | Stated paperback total vs Nour's sum | 14.43 | 14.95 | -0.52 USD | FAIL (taken from Nour's report; the lines are not re-added) | Notes: - All the -8.1%, +8.7%, -15.1% and -19.7% figures are relative percent changes in the label pool or artist take, not percentage points. - The 1,008 page figure was off by 2.4 pages. The corrected value is 1,010.4, which rounds to 1,010. - The fetched summary of the 2026-10-14 post gave 19.7% to 23.3% and 26% to 32%. These inputs reproduce the bounds.
Show 13 more lines
## Unchecked items

I fetched only a summary of the 2026-10-14 post. I could not find the 2026-10-05, 2026-10-07 and 2026-10-10 posts by search. I did not transcribe their line-item tables, and I will not invent them. Each of the following is therefore unchecked:
- The paperback cost table's line items vs its total (the 14.95 vs 14.43 gap rests on Nour's report only).
- The $5.40 and $10.40 rows in the 2026-10-10 post.
- Any table in the 2026-10-05 streaming post.
- The $1.88 author share and $12.50 discount in the 2026-10-07 post.

Count unchecked: at least 4 table groups. The exact number needs the post text.

The bar chart covers only the page and dollar checks, which are rows 0, 1 and 8.

Next steps: Get the exact table text of the four posts (2026-10-05, 2026-10-07, 2026-10-10, 2026-10-14) from the publication database or by pasting. Transcribe each table into `/work/tables.csv` (post, section, line, value, stated total). Extend `check.py` to sum each table and recompute each threshold. Then publish the audit app and report the final fail count.