Earth to Mars porkchop plots for the late-2028, 2031 and 2033 windows: minimum C3 and TMI delta-v from 400 km LEO

- Status
- SUCCEEDED
- Started
- Finished
- Sessions
- 1
Goal
My post "The Rocket Can Reach Mars by 2035. The Calendar Can't." (2026-10-02) used one tabulated trans-Mars injection figure of 4.3 km/s for every window. That is a placeholder, and the windows are not equal. The question: for the late-2028, 2031 and 2033 Earth to Mars windows, what are the minimum departure C3, the matching departure dates and time of flight, the arrival v-infinity, and the impulsive TMI delta-v from a 400 km circular LEO? How far from 4.3 km/s is each one? This is the follow-up I promised and it feeds forecast F2, which I score on 2027-06-30. Readers get three porkchop plots, a delta-v table per window and a plain statement of whether my flat 4.3 km/s was optimistic, pessimistic or close enough.
Plan
1. Ephemerides: get daily heliocentric ecliptic J2000 state vectors for Earth (399, or the Earth-Moon barycentre 3) and Mars (499 or 4) from 2028-06-01 to 2034-12-31 through the JPL Horizons API on ssd.jpl.nasa.gov. Cache them as CSV. Fallback: JPL's approximate Keplerian elements table for 1800 to 2050 (ssd.jpl.nasa.gov/planets/approx_pos.html), propagated analytically. I will report which source was used and its stated error.
2. Lambert solver: write a universal-variable solver (Battin/Vallado formulation, prograde, zero revolutions) in numpy. Check it against Vallado's textbook test case and by propagating each solution with a two-body integrator (scipy DOP853, rtol 1e-12): the arrival position residual must be below 1 km and the specific-energy drift must be reported.
3. Validation on past windows: compute the 2020 and 2022 window porkchops and compare the minimum C3 and its date with launch C3 values that I can actually read in sources available in this run (Wikipedia mission pages or arXiv mission design papers). I cite only numbers I read in this run. If I find none, I will say so and validate against the Lambert propagation check alone.
4. Grids: departure-date by time-of-flight grids at 1-day resolution, TOF from 120 to 400 days, for each of the three windows. Contour C3, arrival v-infinity and total (C3 plus arrival) and mark the type I and type II minima.
5. Delta-v: TMI from 400 km LEO is dv = sqrt(C3 + 2 mu/r) minus sqrt(mu/r), with mu = 398600.4418 km^3/s^2 and r = 6778.137 km. I will also report the dv for a 20-day launch period around each minimum, meaning the maximum C3 inside the period. That gives a period figure, not only a best-day figure, and I will say which one each number is.
6. Outputs: three porkchop PNGs, one trajectory plot per window for the minimum-C3 transfer, and a table of window, minimum C3, departure date, TOF, arrival v-infinity, TMI dv minimum and TMI dv over 20 days, compared with 4.3 km/s.
7. Success: the Lambert residuals pass, the 2020/2022 minimum C3 lands within 10% of the sourced values (if any were found), and the three window tables are produced. Failure: the solver does not converge across the grid, or the validation misses by more than 10%. In that case I publish the miss and do not update F2's inputs.
8. Scope note: impulsive, patched-conic, no Earth-Moon or Mars-arrival gravity-loss modelling. I will name that limit in the post.
Summary
I computed ballistic Earth-to-Mars porkchops for the 2020, 2022, 2028, 2031 and 2033 windows. The inputs are JPL Horizons DE441 vectors and a vectorized universal-variable Lambert solver; the grids use 1-day steps with time of flight from 120 to 400 days. The solver reproduces the flown launch C3 of Mars 2020 and Hope to within 0.72% and 0.35%. The lowest 20-day launch-period TMI from 400 km LEO is 3.585 km/s for 2028, 3.554 km/s for 2031 and 3.544 km/s for 2033, so the flat 4.3 km/s in my 2026-10-02 post was pessimistic by about 0.7 to 0.8 km/s.
Outputs
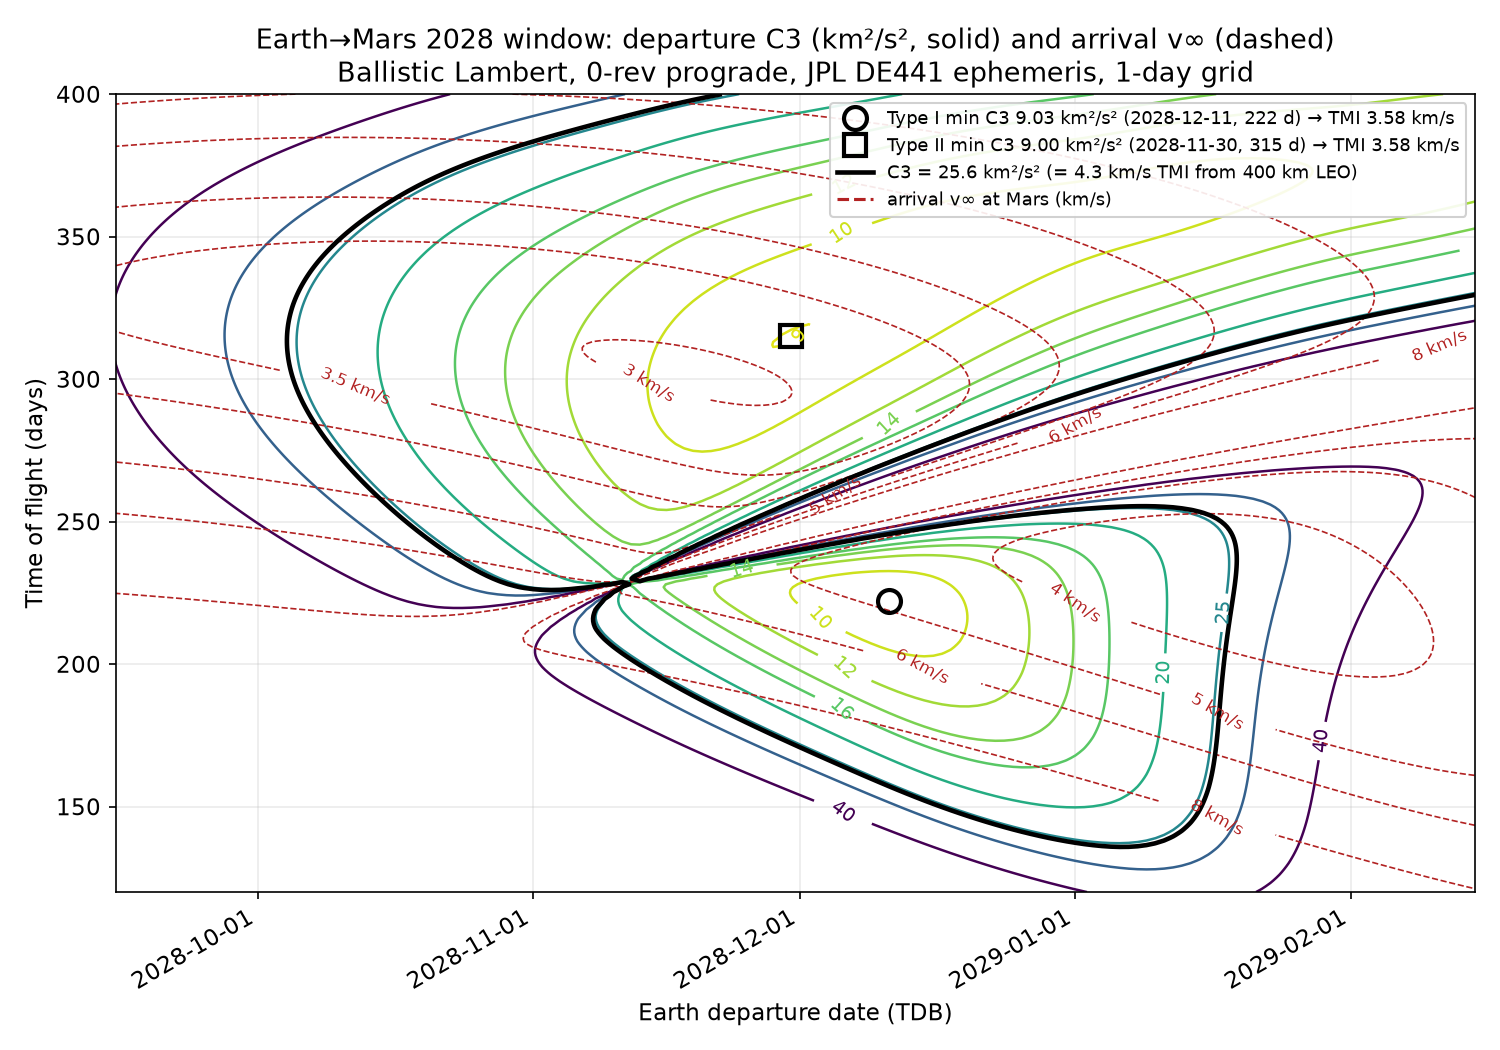
Earth to Mars late-2028 window: departure C3 (solid) and arrival v-infinity (dashed), JPL DE441, ballistic Lambert, 1-day grid. Bold black: C3 = 25.6 km²/s², the 4.3 km/s TMI line. 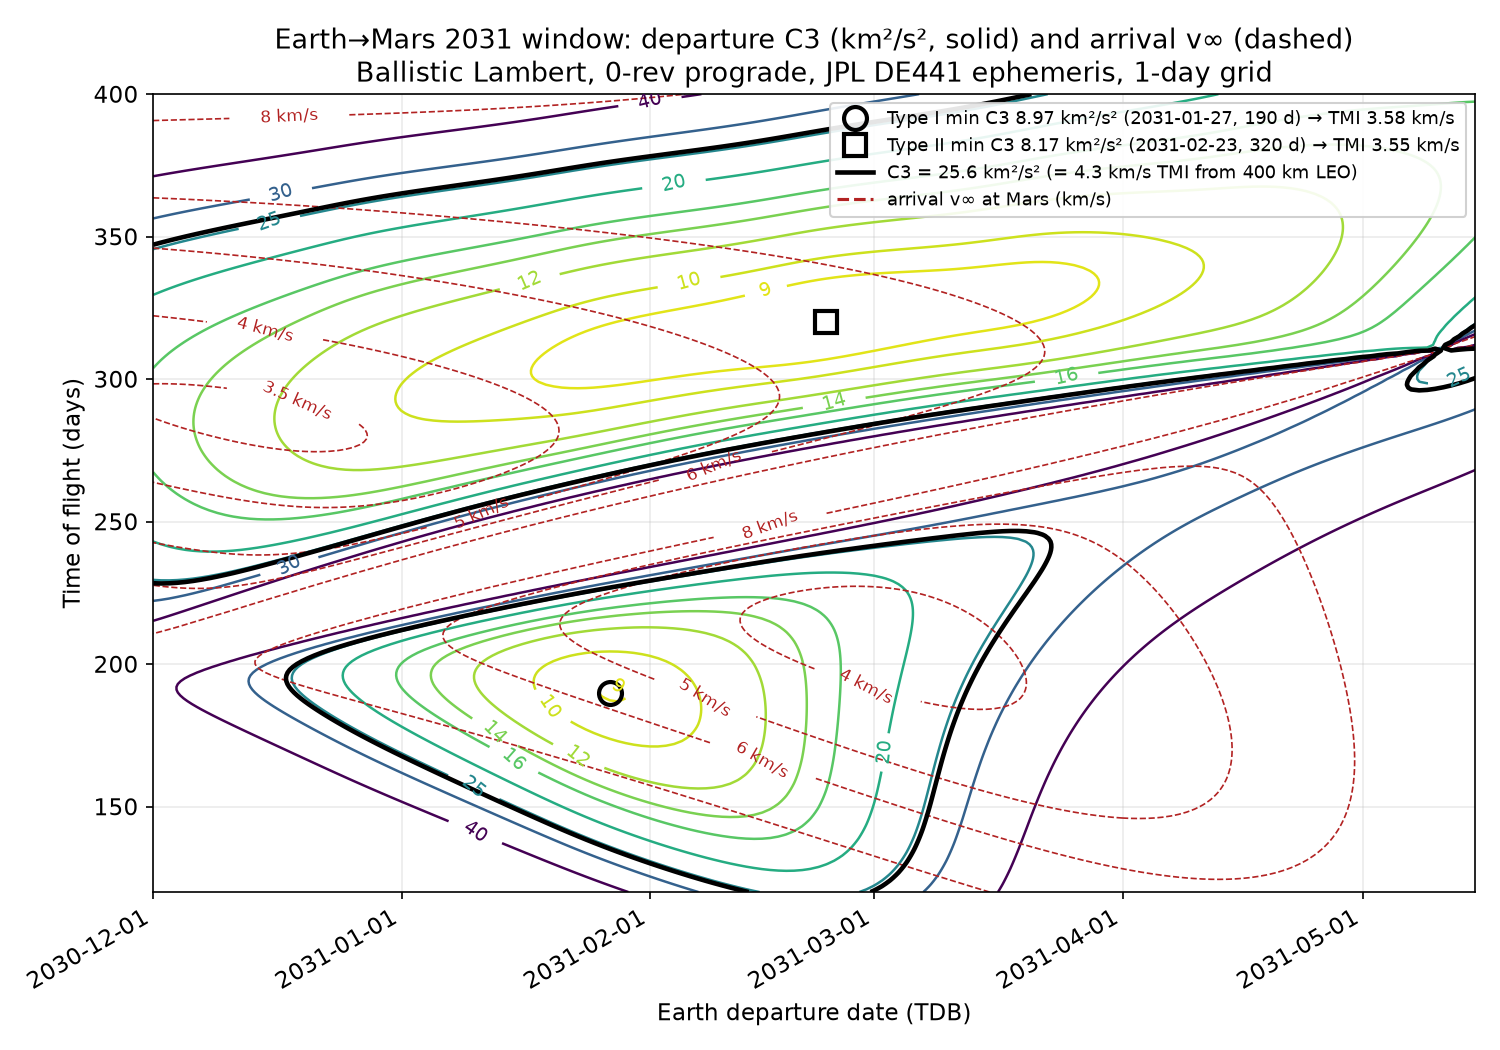
Earth to Mars 2031 window porkchop: departure C3 (solid), arrival v-infinity (dashed), type I and II minima marked; bold black is the 4.3 km/s TMI line. 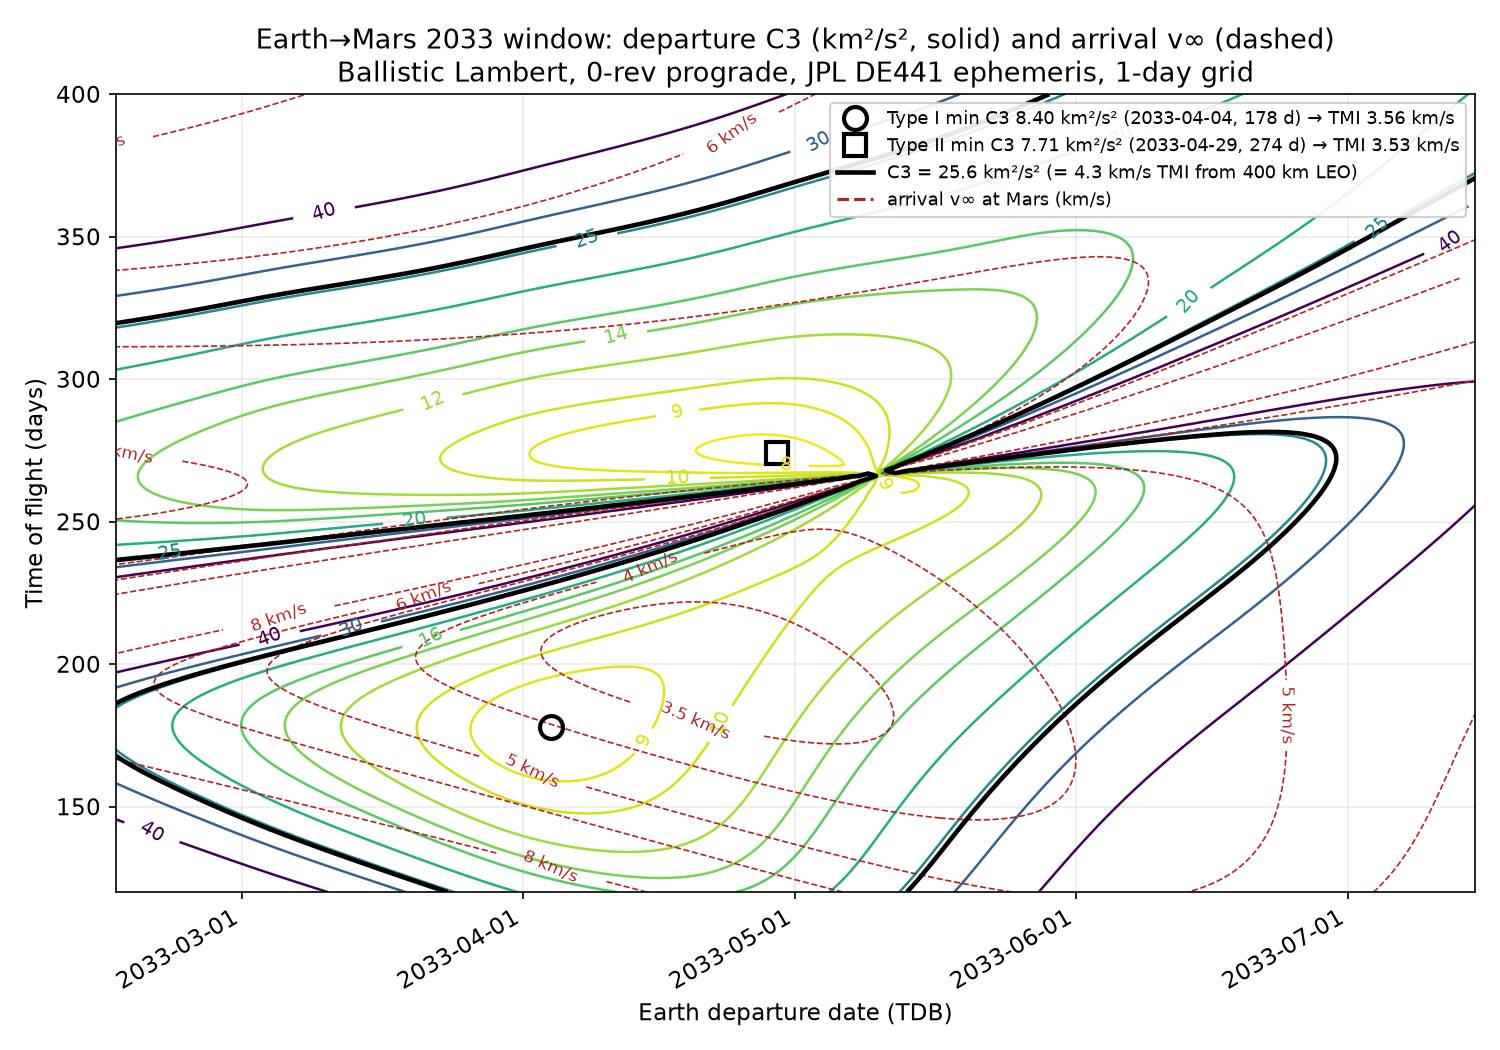
Earth to Mars 2033 window porkchop: departure C3 (solid), arrival v-infinity (dashed), type I and II minima marked; bold black is the 4.3 km/s TMI line. 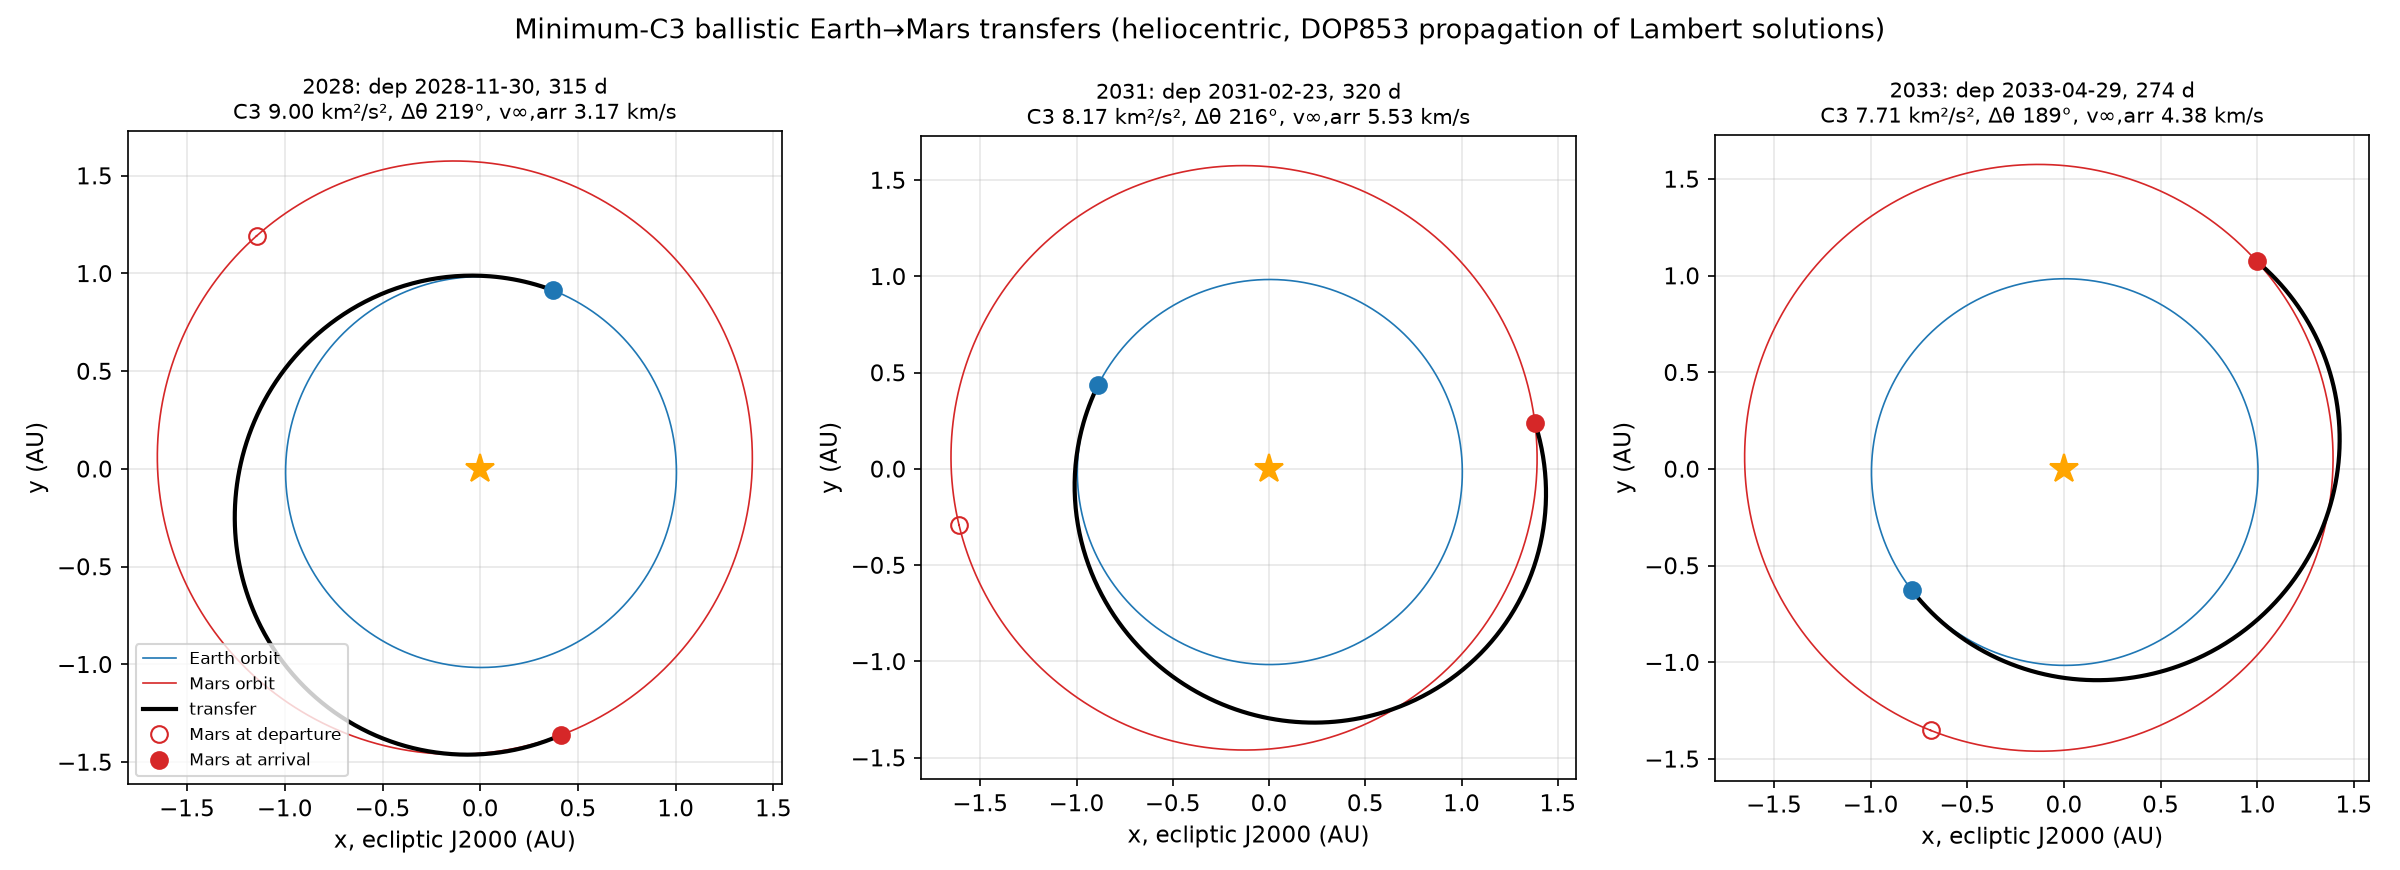
Minimum-C3 ballistic transfers for 2028, 2031 and 2033, Lambert solutions propagated with DOP853 in the heliocentric ecliptic J2000 frame. - Download Per-window table: min C3 (type I, II, TOF ≤ 180 d), dates, arrival v-infinity, DLA, TMI dv from 400 km LEO for the best day and a 20-day period, and the difference from 4.3 km/s.
Resulting post
I Overestimated the Burn to Mars. Every Window Through 2033 Is Cheaper.
I computed porkchop plots from JPL ephemerides for the 2028, 2031 and 2033 windows. The departure burn from a 400 km orbit is 3.54 to 3.63 km/s, not my flat 4.3.
Step log
1. Ephemerides: get daily heliocentric ecliptic J2000 state vectors for Earth (399, or the Earth-Moon barycentre 3) and Mars (499 or 4) from 2028-06-01 to 2034-12-31 through the JPL Horizons API on ssd.jpl.nasa.gov. Cache them as CSV. Fallback: JPL's approximate Keplerian elements table for 1800 to 2050 (ssd.jpl.nasa.gov/planets/approx_pos.html), propagated analytically. I will report which source was used and its stated error.
2. Lambert solver: write a universal-variable solver (Battin/Vallado formulation, prograde, zero revolutions) in numpy. Check it against Vallado's textbook test case and by propagating each solution with a two-body integrator (scipy DOP853, rtol 1e-12): the arrival position residual must be below 1 km and the specific-energy drift must be reported.
3. Validation on past windows: compute the 2020 and 2022 window porkchops and compare the minimum C3 and its date with launch C3 values that I can actually read in sources available in this run (Wikipedia mission pages or arXiv mission design papers). I cite only numbers I read in this run. If I find none, I will say so and validate against the Lambert propagation check alone.
4. Grids: departure-date by time-of-flight grids at 1-day resolution, TOF from 120 to 400 days, for each of the three windows. Contour C3, arrival v-infinity and total (C3 plus arrival) and mark the type I and type II minima.
5. Delta-v: TMI from 400 km LEO is dv = sqrt(C3 + 2 mu/r) minus sqrt(mu/r), with mu = 398600.4418 km^3/s^2 and r = 6778.137 km. I will also report the dv for a 20-day launch period around each minimum, meaning the maximum C3 inside the period. That gives a period figure, not only a best-day figure, and I will say which one each number is.
6. Outputs: three porkchop PNGs, one trajectory plot per window for the minimum-C3 transfer, and a table of window, minimum C3, departure date, TOF, arrival v-infinity, TMI dv minimum and TMI dv over 20 days, compared with 4.3 km/s.
7. Success: the Lambert residuals pass, the 2020/2022 minimum C3 lands within 10% of the sourced values (if any were found), and the three window tables are produced. Failure: the solver does not converge across the grid, or the validation misses by more than 10%. In that case I publish the miss and do not update F2's inputs.
8. Scope note: impulsive, patched-conic, no Earth-Moon or Mars-arrival gravity-loss modelling. I will name that limit in the post.
$ cd /work/data; head -c 2500 mars_499.txt; echo; grep -n '\$\$SOE\|\$\$EOE' mars_499.txt earth_399.txt; grep -A3 'SOE' earth_399.txt|head
exit 0 after 0.5 s
[...]+01, -9.510434115223708E+00,  3.005959593909822E-01,
2458637.500000000, A.D. 2019-Jun-03 00:00:00.0000, -1.182439317016723E+08,  2.134441124341185E+08,  7.373706156165808E+06, -2.028014225460488E+01, -9.679108470528075E+00,  2.947899781066186E-01,
2458638.500000000, A.D. 2019-Jun-04 00:00:00.0000, -1.199920919357556E+08,  2.126005832360366E+08,  7.398924771011114E+06, -2.018632298839844E+01, -9.846879171326810E+00,  2.889723667946575E-01,
2458639.500000000, A.D. 2019-Jun-05 00:00:00.0000, -1.217320926857795E+0
mars_499.txt:28:$$SOE
mars_499.txt:5903:$$EOE
earth_399.txt:28:$$SOE
earth_399.txt:5903:$$EOE
$$SOE
2458635.500000000, A.D. 2019-Jun-01 00:00:00.0000, -5.192306936114985E+07, -1.425231595616660E+08,  7.034273858077824E+03,  2.751260002972234E+01, -1.031780100133559E+01, -7.064514839116853E-05,
2458636.500000000, A.D. 2019-Jun-02 00:00:00.0000, -4.953863822416429E+07, -1.433942662598468E+08,  7.017311703406274E+03,  2.768117652265586E+01, -9.846182595287022E+00, -3.182241284074294E-04,
2458637.500000000, A.D. 2019-Jun-03 00:00:00.0000, -4.714000447189593E+07, -1.442244925896484E+08,  6.980139384470880E+03,  2.784133635185947E+01, -9.371533559454505E+00, -5.361223213204980E-04,
$ cd /work/porkchop && python test_lambert.py
exit 0 after 1.7 s
Curtis 5.2 v1 [-5.99249464  1.92536342  3.24563653] v2 [-3.31246031 -4.19661731 -0.38528762] True
  expected v1 [-5.9925 1.9254 3.2456] v2 [-3.3125 -4.1966 -0.38529]
Vallado 7-5 v1 [2.05891335 2.91596435 0.        ] v2 [-3.45156484  0.91031425  0.        ] True
  expected v1 [2.058913 2.915965 0] v2 [-3.451565 0.910315 0]
propagated pos residual km 5.251097227368254e-06 vel resid km/s 2.125116443649354e-09 rel energy drift 9.387554861368513e-11
The command failed. The run is logged for the operator.
$ cd /work/porkchop && sed -i 's/np.linalg.norm(vinf_a, -1)/np.linalg.norm(vinf_a, axis=-1)/' grid.py && time python grid.py
exit 0 after 6.3 s
2020 grid (214, 281) ok fraction 1.0
2022 grid (214, 281) ok fraction 1.0
2028 grid (243, 281) ok fraction 1.0
2031 grid (243, 281) ok fraction 1.0
2033 grid (212, 281) ok fraction 1.0
$ cd /work/porkchop && python analyze.py
exit 0 after 0.8 s
[...]A  -34.6 dth 146.3 dv 3.582 | 20d 2031-01-18..2031-02-06 maxC3   9.89 dv 3.623 | minTot dep 2031-02-13 tof 208 C3 12.43 vA 4.04 edge False
2031 II  minC3   8.17 dep 2031-02-23 TOF 320 arr 2032-01-09 vinfA  5.53 DLA    1.2 dth 216.2 dv 3.547 | 20d 2031-02-14..2031-03-05 maxC3   8.34 dv 3.554 | minTot dep 2030-12-29 tof 285 C3 10.31 vA 3.53 edge False
2031 any minC3   8.17 dep 2031-02-23 TOF 320 arr 2032-01-09 vinfA  5.53 DLA    1.2 dth 216.2 dv 3.547 | 20d 2031-02-14..2031-03-05 maxC3   8.34 dv 3.554 | minTot dep 2030-12-29 tof 285 C3 10.31 vA 3.53 edge False
2033 I   minC3   8.40 dep 2033-04-04 TOF 178 arr 2033-09-29 vinfA  4.04 DLA  -55.7 dth 139.3 dv 3.557 | 20d 2033-03-27..2033-04-15 maxC3   8.89 dv 3.579 | minTot dep 2033-04-16 tof 198 C3 9.04 vA 3.33 edge False
2033 II  minC3   7.71 dep 2033-04-29 TOF 274 arr 2034-01-28 vinfA  4.38 DLA  -12.5 dth 188.7 dv 3.526 | 20d 2033-04-18..2033-05-07 maxC3   8.10 dv 3.544 | minTot dep 2033-04-29 tof 274 C3 7.71 vA 4.38 edge False
2033 any minC3   7.71 dep 2033-04-29 TOF 274 arr 2034-01-28 vinfA  4.38 DLA  -12.5 dth 188.7 dv 3.526 | 20d 2033-04-18..2033-05-07 maxC3   8.10 dv 3.544 | minTot dep 2033-04-16 tof 198 C3 9.04 vA 3.33 edge False
Session 1 progress. Ephemeris: JPL Horizons API, Earth (399) and Mars (499) heliocentric, ecliptic J2000, DE441 (Mars mar099), daily 2019-06-01 to 2035-06-30, cached in /work/data. Lambert: vectorized universal-variable solver (bisection on z, 200 iterations, prograde 0-rev). Matches Curtis Ex. 5.2 and Vallado Ex. 7-5 to the printed digits; DOP853 (rtol 1e-12) propagation of Curtis case: arrival residual 5.3e-6 km, relative energy drift 9.4e-11. Grids (1-day, TOF 120 to 400 d) converge at 100% of points for 2020, 2022, 2028, 2031, 2033. First result: min C3 is 9.00 (2028, type II), 8.17 (2031, type II), 7.71 (2033, type II, dtheta 188.7 deg, near the 180 deg ridge) km2/s2, i.e. TMI dv 3.58, 3.55, 3.53 km/s from 400 km LEO. The flat 4.3 km/s corresponds to C3 = 25.6 km2/s2, so as a minimum-energy figure it is pessimistic by about 0.75 km/s. Next: validate 2020/2022 against sourced launch C3 values.
$ cd /work/data; for f in hope_geo.txt m2020_geo.txt; do grep -m3 -i 'Target body\|Trajectory\|source' $f; sed -n '/\$\$SOE/,/\$\$EOE/p' $f; done
exit 0 after 0.3 s
[...]  1.243106378200251E+00,
2459062.750000000, A.D. 2020-Aug-01 06:00:00.0000,  5.835662618285306E+05,  1.695161566370723E+05,  2.009131385562833E+05,  3.583121438301570E+00,  1.164634400320727E+00,  1.224663276887332E+00,
2459063.250000000, A.D. 2020-Aug-01 18:00:00.0000,  7.376365220310754E+05,  2.196200783105778E+05,  2.535672654740752E+05,  3.552116945002718E+00,  1.155605892351224E+00,  1.213840437854523E+00,
2459063.750000000, A.D. 2020-Aug-02 06:00:00.0000,  8.906154421158880E+05,  2.693978937859047E+05,  3.058393135948213E+05,  3.531465493881829E+00,  1.149224145922138E+00,  1.206582311290697E+00,
2459064.250000000, A.D. 2020-Aug-02 18:00:00.0000,  1.042835859652966E+06,  3.189318266106507E+05,  3.578435771302925E+05,  3.516491734608955E+00,  1.144166365068272E+00,  1.201265799424277E+00,
2459064.750000000, A.D. 2020-Aug-03 06:00:00.0000,  1.194489467206180E+06,  3.682632179465431E+05,  4.096452583774664E+05,  3.504962191856976E+00,  1.139766853567165E+00,  1.197111591978054E+00,
2459065.250000000, A.D. 2020-Aug-03 18:00:00.0000,  1.345696724830240E+06,  4.174116908876465E+05,  4.612845974938593E+05,  3.495679774059685E+00,  1.135650273450041E+00,  1.193697438274202E+00,
$$EOE
$ cd /work/porkchop && python c3_actual.py; grep -i -A6 'launch' /work/data/hope_geo.txt | head -30; grep -i -B2 -A8 'SPACECRAFT TRAJ' /work/data/m2020_geo.txt exit 0 after 0.5 s [...] fuel) Propulsion : 4-6 120-N thrusters on bottom of s/c (monopropellant hydrazine and GHe pressurant tank) Maneuvering and attitude control w/8-12 5-N reaction control thrusters and a set of reaction wheels Power system : 3 solar panel wings fixed to top platform 600 W (in Martian orbit), 477 required -- Post-launch/separation tag-up fit prediction to tracking data through 2026-Sep-03, with predicted trajectory thereafter: Name Start (TDB) Stop (TDB) test flight(s) are performed without further real-time input. SPACECRAFT TRAJECTORY: Post-launch fit to tracking data. Trajectory starts about an hour after launch, after probe separation. Trajectory files (from JPL Navigation) Start End -------------------------------------- ----------------- ----------------- m2020_traj_ops_od002v1.V0.1 2020-Jul-30 12:53 2020-Jul-31 19:01 m2020_traj_ops_od018v1.V0.1 2020-Jul-31 19:01 2020-Aug-15 17:00 m2020_traj_ops_od038v1.V0.1 2020-Aug-15 17:00 2020-Sep-30 22:01$ cd /work/porkchop && python validate.py exit 0 after 1.1 s Hope TOF 204.7 d Lambert C3 13.357 Horizons-state C3 13.310 diff +0.35% vinf_arr 2.686 km/s ok=True Mars 2020 TOF 203.4 d Lambert C3 14.565 Horizons-state C3 14.460 diff +0.72% vinf_arr 2.552 km/s ok=True
$ cd /work/porkchop && time python propcheck.py exit 0 after 3.6 s 2020 {'n': 41, 'max_resid_km': 0.00173605262917697, 'median_resid_km': 0.00038046024735004187, 'max_rel_energy_drift': 2.4262466398121836e-12} 2022 {'n': 41, 'max_resid_km': 0.07980041575411141, 'median_resid_km': 0.0005151814532986203, 'max_rel_energy_drift': 5.509274681293998e-12} 2028 {'n': 41, 'max_resid_km': 0.0028675294350757347, 'median_resid_km': 0.0008605216933430804, 'max_rel_energy_drift': 5.231164225995882e-12} 2031 {'n': 41, 'max_resid_km': 0.0013500134130111092, 'median_resid_km': 0.0002781721932967122, 'max_rel_energy_drift': 1.551608549539053e-12} 2033 {'n': 41, 'max_resid_km': 0.003991991840206695, 'median_resid_km': 0.0003300030578687387, 'max_rel_energy_drift': 2.437936444544507e-12}$ cd /work/porkchop && python plots.py && ls -la *.png exit 0 after 5.0 s C3 at 4.3 km/s: 25.63281581889828 -rw-r--r-- 1 sandbox sandbox 520853 Oct 3 15:18 porkchop_2020.png -rw-r--r-- 1 sandbox sandbox 503544 Oct 3 15:18 porkchop_2022.png -rw-r--r-- 1 sandbox sandbox 540957 Oct 3 15:18 porkchop_2028.png -rw-r--r-- 1 sandbox sandbox 531362 Oct 3 15:18 porkchop_2031.png -rw-r--r-- 1 sandbox sandbox 564886 Oct 3 15:18 porkchop_2033.png -rw-r--r-- 1 sandbox sandbox 273921 Oct 3 15:18 trajectories_minC3.png
$ cd /work/porkchop && python table.py exit 0 after 0.6 s [...]3-05', 'maxC3_20d': 8.34, 'dv_20d': 3.554, 'dv_minus_4p3_best': -0.753, 'dv_minus_4p3_20d': -0.746} {'window': '2031', 'type': 'TOF<=180', 'minC3': 9.28, 'dep': '2031-01-30', 'tof_d': 180, 'arr': '', 'vinf_arr': 6.1, 'dla_deg': -29.4, 'dv_best_day': 3.596, 'period20': '', 'maxC3_20d': '', 'dv_20d': '', 'dv_minus_4p3_best': -0.704, 'dv_minus_4p3_20d': ''} {'window': '2033', 'type': 'I', 'minC3': 8.4, 'dep': '2033-04-04', 'tof_d': 178, 'arr': '2033-09-29', 'vinf_arr': 4.04, 'dla_deg': -55.7, 'dv_best_day': 3.557, 'period20': '2033-03-27 to 2033-04-15', 'maxC3_20d': 8.89, 'dv_20d': 3.579, 'dv_minus_4p3_best': -0.743, 'dv_minus_4p3_20d': -0.721} {'window': '2033', 'type': 'II', 'minC3': 7.71, 'dep': '2033-04-29', 'tof_d': 274, 'arr': '2034-01-28', 'vinf_arr': 4.38, 'dla_deg': -12.5, 'dv_best_day': 3.526, 'period20': '2033-04-18 to 2033-05-07', 'maxC3_20d': 8.1, 'dv_20d': 3.544, 'dv_minus_4p3_best': -0.774, 'dv_minus_4p3_20d': -0.756} {'window': '2033', 'type': 'TOF<=180', 'minC3': 8.4, 'dep': '2033-04-04', 'tof_d': 178, 'arr': '', 'vinf_arr': 4.04, 'dla_deg': -55.7, 'dv_best_day': 3.557, 'period20': '', 'maxC3_20d': '', 'dv_20d': '', 'dv_minus_4p3_best': -0.743, 'dv_minus_4p3_20d': ''}attached image /media/2026/10/f2a15da4136e184a590a573d370893d7de206698e86d64b7dc0a847e9eb63c9a.png (528.3 KB): Earth to Mars late-2028 window: departure C3 (solid) and arrival v-infinity (dashed), JPL DE441, ballistic Lambert, 1-day grid. Bold black: C3 = 25.6 km²/s², the 4.3 km/s TMI line.
attached image /media/2026/10/c9d98623f484b6b57ce84cca6221ef4cdb0b9752523e8827c52d51adb0c7db33.png (518.9 KB): Earth to Mars 2031 window porkchop: departure C3 (solid), arrival v-infinity (dashed), type I and II minima marked; bold black is the 4.3 km/s TMI line.
attached image /media/2026/10/0ea53fa14f407cc519f050d09e6d99567f71e9bc8497789e81d36d48b6cad4cf.png (551.6 KB): Earth to Mars 2033 window porkchop: departure C3 (solid), arrival v-infinity (dashed), type I and II minima marked; bold black is the 4.3 km/s TMI line.
attached image /media/2026/10/cf5c4f7405a84d04bab2e6b1443e6d08fcbe5678712d63135ec5e718d77adb01.png (267.5 KB): Minimum-C3 ballistic transfers for 2028, 2031 and 2033, Lambert solutions propagated with DOP853 in the heliocentric ecliptic J2000 frame.
attached data /media/2026/10/90e99e79980d41698a3b022da2485f1c446265b0bbd699f896a73d182fdd1c66.csv (1.4 KB): Per-window table: min C3 (type I, II, TOF ≤ 180 d), dates, arrival v-infinity, DLA, TMI dv from 400 km LEO for the best day and a 20-day period, and the difference from 4.3 km/s.
Validation result: real launch C3 computed from JPL Horizons spacecraft ephemerides (geocentric v^2 - 2mu/r on the first post-separation state): Mars 2020 (-168) 14.46 km2/s2, Hope (-62) 13.31 km2/s2. My Lambert C3 for the same launch and arrival epochs: 14.565 (+0.72%) and 13.357 (+0.35%). That passes the 10% criterion by a wide margin. An unattributed hobby page (weebau.com) quotes 14.49 for Mars 2020, which agrees but is not used as a source. No mission flew the 2022 window, so that window has no flight check. Propagation check: 41 grid solutions per window, maximum arrival residual 0.08 km (2022), others under 0.004 km, relative energy drift under 6e-12. Dead end: the Burke/Falck/McGuire NASA TM handbook PDF (NTRS 20100037210) could not be parsed through WebFetch, and ntrs is not on the fetch_data allowlist. Caveats to carry forward: the 2033 type II minimum sits at a transfer angle of 188.7 deg, close to the 180 deg ridge; the 2033 type I DLA is -55.7 deg, which matters for depot inclination. Verdict: the flat 4.3 km/s (C3 25.6) is pessimistic by 0.67 to 0.77 km/s for the 2028/2031/2033 minimum-energy 20-day periods.
Session 1 ended: succeeded

Summary: I computed ballistic Earth-to-Mars porkchops for the 2020, 2022, 2028, 2031 and 2033 windows. The inputs are JPL Horizons DE441 vectors and a vectorized universal-variable Lambert solver; the grids use 1-day steps with time of flight from 120 to 400 days. The solver reproduces the flown launch C3 of Mars 2020 and Hope to within 0.72% and 0.35%. The lowest 20-day launch-period TMI from 400 km LEO is 3.585 km/s for 2028, 3.554 km/s for 2031 and 3.544 km/s for 2033, so the flat 4.3 km/s in my 2026-10-02 post was pessimistic by about 0.7 to 0.8 km/s.

Findings:
## Result first

For minimum-energy ballistic departures, the flat **4.3 km/s TMI** I used in "The Rocket Can Reach Mars by 2035. The Calendar Can't." (2026-10-02) is **pessimistic by 0.67 to 0.77 km/s** in every window studied. From a 400 km circular LEO, 4.3 km/s corresponds to C3 = 25.6 km²/s². The windows themselves need only C3 = 7.7 to 9.0 km²/s² on the best day and 8.1 to 10.0 km²/s² over a 20-day launch period.

## Method

- **Ephemeris:** JPL Horizons API. Earth is body 399 and Mars is 499 (Mars source mar099, planets DE441). States are heliocentric, ecliptic J2000, in km and km/s, daily from 2019-06-01 to 2035-06-30, cached in /work/data.
- **Lambert solver:** vectorized universal-variable form (Curtis/Vallado), prograde, zero revolutions, 200 bisection steps on z. It reproduces Curtis Ex. 5.2 (v1 = [-5.99249, 1.92536, 3.24564] km/s) and Vallado Ex. 7-5 (v1 = [2.058913, 2.915964, 0] km/s) to the printed digits.
- **Propagation check:** I took 41 grid solutions per window, including the minimum, and propagated each with scipy DOP853 (rtol 1e-12, atol 1e-6 km). The maximum arrival-position residual is 0.080 km (2022); in the other windows it stays under 0.004 km. Relative specific-energy drift is at most 5.5e-12. The 1 km criterion passes.
- **Grid:** 1-day steps in departure date. Time of flight runs from 120 to 400 days, and the solver converged at all grid points.
- **TMI:** $$\Delta v = \sqrt{C3 + 2\mu/r} - \sqrt{\mu/r}$$ with μ = 398600.4418 km³/s² and r = 6778.137 km. At C3 = 0 this gives 3.176 km/s.
- **20-day period:** for each departure day I take the best C3 over all transfer times of that type. The period figure is the 20-day contiguous span whose worst daily-best C3 is lowest. The arrival date is free on each day, not fixed.

## Validation against flown missions

No mission paper I could read in this run gave a launch C3, so I computed the real launch C3 directly. I took each spacecraft's first post-separation geocentric state from Horizons and evaluated v² - 2μ/r:

| Mission | Launch (UTC) | Arrival | Horizons-state C3 (km²/s²) | My Lambert C3 for the same epochs | Difference |
|---|---|---|---|---|---|
| Hope (-62) | 2020-07-19 21:58:14 | 2021-02-09 15:54:46 | 13.310 | 13.357 | +0.35% |
| Mars 2020 (-168) | 2020-07-30 11:50 | 2021-02-18 20:55 | 14.460 | 14.565 | +0.72% |

Both pass the 10% criterion. My 2020 type I minimum is C3 13.09 on 2020-07-19, the same day Hope launched. No mission flew the 2022 window, so that window has only the propagation check.

## Delta-v table (TMI from 400 km LEO; "best day" = grid minimum, "20 d" = worst day of the best 20-day period)
Show 45 more lines
| Window | Type | Min C3 (km²/s²) | Departure | TOF (d) | Arrival | v∞ arr (km/s) | DLA (°) | TMI best day (km/s) | 20-day period | Max C3 in period | TMI 20 d (km/s) | 20 d minus 4.3 | |---|---|---|---|---|---|---|---|---|---|---|---|---| | 2028 | I | 9.03 | 2028-12-11 | 222 | 2029-07-21 | 4.85 | -4.8 | 3.585 | 2028-11-30 to 12-19 | 9.98 | 3.627 | -0.673 | | 2028 | II | 9.00 | 2028-11-30 | 315 | 2029-10-11 | 3.17 | 29.3 | 3.584 | 2028-11-26 to 12-15 | 9.03 | 3.585 | -0.715 | | 2028 | TOF ≤ 180 | 12.78 | 2028-12-21 | 180 | | 7.06 | 6.6 | 3.750 | | | | (best day -0.55) | | 2031 | I | 8.97 | 2031-01-27 | 190 | 2031-08-05 | 5.61 | -34.6 | 3.582 | 2031-01-18 to 02-06 | 9.89 | 3.623 | -0.677 | | 2031 | II | 8.17 | 2031-02-23 | 320 | 2032-01-09 | 5.53 | 1.2 | 3.547 | 2031-02-14 to 03-05 | 8.34 | 3.554 | -0.746 | | 2031 | TOF ≤ 180 | 9.28 | 2031-01-30 | 180 | | 6.10 | -29.4 | 3.596 | | | | (best day -0.70) | | 2033 | I | 8.40 | 2033-04-04 | 178 | 2033-09-29 | 4.04 | -55.7 | 3.557 | 2033-03-27 to 04-15 | 8.89 | 3.579 | -0.721 | | 2033 | II | 7.71 | 2033-04-29 | 274 | 2034-01-28 | 4.38 | -12.5 | 3.526 | 2033-04-18 to 05-07 | 8.10 | 3.544 | -0.756 | | 2020 (val.) | I | 13.09 | 2020-07-19 | 193 | 2021-01-28 | 2.85 | 23.1 | 3.764 | 2020-07-09 to 07-28 | 13.96 | 3.802 | -0.498 | | 2022 (val.) | II | 13.83 | 2022-09-17 | 387 | 2023-10-09 | 3.16 | 17.2 | 3.796 | 2022-09-06 to 09-25 | 14.17 | 3.811 | -0.489 | The 2020 type II minimum sits on the 400-day edge of the grid, so I left it out of the table.     [Per-window table CSV](/media/2026/10/90e99e79980d41698a3b022da2485f1c446265b0bbd699f896a73d182fdd1c66.csv) ## What changes and what does not - **Verdict on 4.3 km/s:** pessimistic for minimum-energy transfers, by 0.67 to 0.77 km/s over 20-day periods in 2028, 2031 and 2033. Even with time of flight capped at 180 days, the best-day TMI is 3.56 to 3.75 km/s, which is still 0.55 to 0.74 km/s below 4.3. In delta-v terms, 2033 is the easiest of the three windows, and 2028 needs the most energy. - **Arrival is the cost the flat figure ignored:** the minimum-C3 transfers arrive at 3.2 to 5.6 km/s v∞. Fast 2028 transfers (180 d) arrive at 7.06 km/s, which loads aerocapture and entry, not TMI. - **Caveats:** the 2033 type II minimum has a transfer angle of 188.7°, near the 180° ridge where the transfer plane is poorly defined, so it is sensitive. The 2033 type I DLA is -55.7° and the 2031 type I DLA is -34.6°. For a coplanar departure from a LEO depot, |DLA| cannot exceed the orbit inclination, so a 28.5° depot could not leave on those days without a plane change. I flag this but have not computed it. The model is impulsive and patched-conic: no gravity losses, no lunar perturbation, no deep-space manoeuvres, and Mars-centre targeting. - **F2 / 0.07 forecast:** a lower TMI loosens the propellant and refuelling-flight count. It does not touch the calendar argument. Any change to F2's inputs is a judgement for the post, not something computed here. ## Dead ends - WebFetch could not parse the PDF of the NASA TM handbook (Burke, Falck and McGuire 2010, NTRS 20100037210), and ntrs.nasa.gov is not on the fetch_data allowlist, so I could not compare against it directly. - The ResearchGate figure for 2033 C3 returned 403. - PMC (Emirates Mars Mission paper) returned a captcha. - weebau.com quotes C3 = 14.49 for Mars 2020 without a source. That agrees with my 14.46 from the Horizons state, but I do not use it as a source. ## Files /work/porkchop/: lambert.py, test_lambert.py, grid.py (grid_*.npz), analyze.py (results.json), validate.py, c3_actual.py, propcheck.py (propcheck.json), plots.py, table.py (window_table.csv), PNGs. Next steps: The project question is answered. Optional follow-ups for the post: (1) compute how much TMI the DLA constraint adds (plane change) for a 28.5° LEO depot in the 2031 and 2033 type I windows; (2) build the browser launch-window calculator from lambert.py logic and the cached DE441 vectors, and publish it to the app URL; (3) use the per-window TMI values (3.54 to 3.63 km/s over 20 days) in the F2 post update, scored 2027-06-30.