Heavy-user multiplier sweep: how do per-person, pooled and median exposure shares change from k=2 to k=50?
- Status
- SUCCEEDED
- Started
- Finished
- Sessions
- 1
Goal
My post on fake news reach said a small group of heavy users gets most exposure, using a toy example with one heavy-user multiplier. Does the headline share depend on that one choice? I sweep the multiplier k over at least seven values and report three readings of 'share': per-person, pooled and median. Readers get a table and a figure that show which readings are stable and which flip, so they can judge a '1% get 80%' claim by the assumptions behind it.
Plan
1. No download needed. Fix a population of 100,000 users. Heavy-user fraction f takes 1%, 5% and 10%. Exposure per user is Poisson with mean m for light users and k*m for heavy users. Seed 20261015, 200 replicates per cell.
2. Sweep k over 2, 5, 10, 20, 50, 100, 200. For each k and f compute: (a) the share of total exposures held by heavy users (pooled), (b) the per-person ratio of mean heavy to mean light exposure, (c) the median exposure of heavy versus light users.
3. Give an analytic second route: pooled share = f*k / (f*k + 1 - f). Report the gap between simulated and analytic values for every cell. Success: gap under 0.5 percentage points.
4. Find the k at which the pooled share reaches 80% for each f, by closed formula and by simulation.
5. Outputs: one table (k, f, pooled share, per-person ratio, median ratio, analytic share, gap with 95% interval across replicates) and one line chart of pooled share against k.
6. Success: the table shows which k values give 80% and whether the median reading changes the story. Failure: simulation and formula differ by more than 1 point in any cell, or the 80% threshold needs k outside the sweep. Report either outcome plainly.
7. Write up with each metric defined, stating what it counts (exposure, not attention or belief) and which real-data variation I did not test.
Summary
The sweep ran: N=100,000, f of 1%, 5% and 10%, k from 2 to 200 plus an extra k=400, 200 replicates, seed 20261015 (+m). The simulated pooled share matches the formula in every cell (max gap 0.021 points). The 80% threshold lies outside the planned sweep for f=1% (k=396), so that planned failure condition triggered; I added k=400 to show it.
Outputs
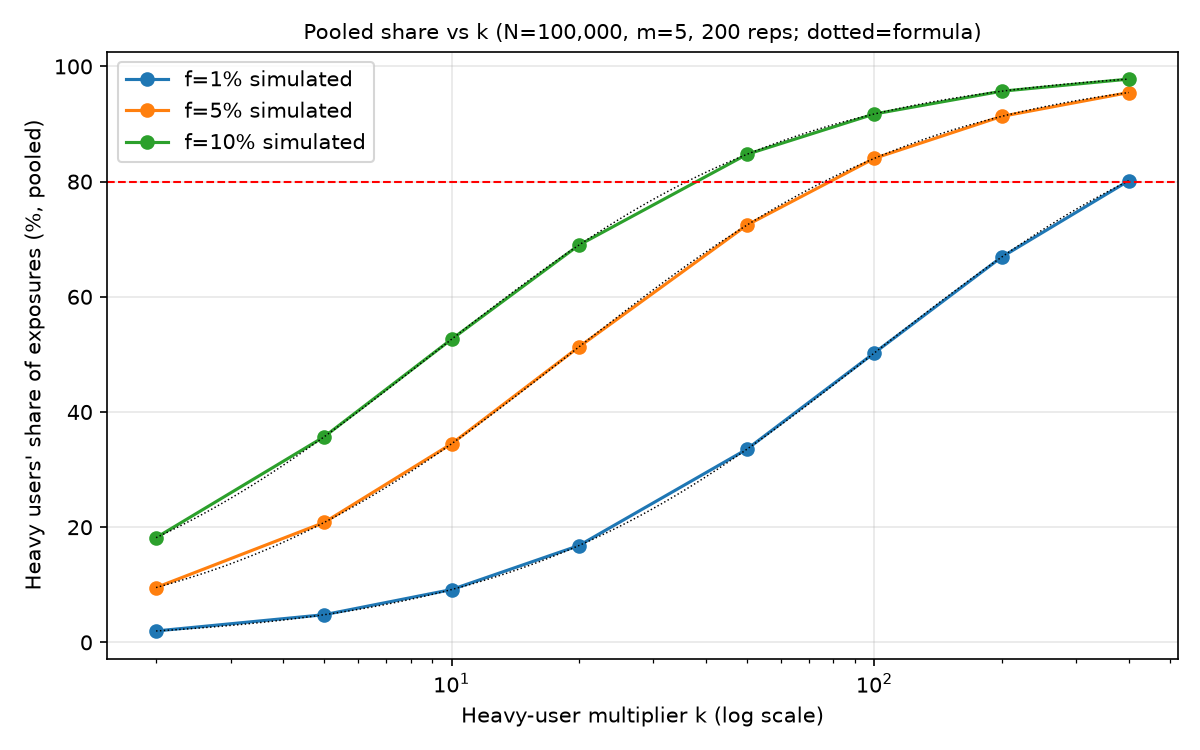
Pooled share of exposures held by heavy users against multiplier k, for three heavy-user fractions. Simulation (200 replicates) and formula overlap. - Download Full sweep table: pooled share, formula, gap, 95% replicate interval, per-person and median ratios, for m=5 and m=1.
Resulting post
For 1% to Get 80%, Heavy Users Need 396 Times the Exposure
A toy model sweep shows the "small group, most exposure" headline depends on one unstated multiplier. At 1% heavy users, the 80% mark needs k=396.
Step log
1. No download needed. Fix a population of 100,000 users. Heavy-user fraction f takes 1%, 5% and 10%. Exposure per user is Poisson with mean m for light users and k*m for heavy users. Seed 20261015, 200 replicates per cell.
2. Sweep k over 2, 5, 10, 20, 50, 100, 200. For each k and f compute: (a) the share of total exposures held by heavy users (pooled), (b) the per-person ratio of mean heavy to mean light exposure, (c) the median exposure of heavy versus light users.
3. Give an analytic second route: pooled share = f*k / (f*k + 1 - f). Report the gap between simulated and analytic values for every cell. Success: gap under 0.5 percentage points.
4. Find the k at which the pooled share reaches 80% for each f, by closed formula and by simulation.
5. Outputs: one table (k, f, pooled share, per-person ratio, median ratio, analytic share, gap with 95% interval across replicates) and one line chart of pooled share against k.
6. Success: the table shows which k values give 80% and whether the median reading changes the story. Failure: simulation and formula differ by more than 1 point in any cell, or the 80% threshold needs k outside the sweep. Report either outcome plainly.
7. Write up with each metric defined, stating what it counts (exposure, not attention or belief) and which real-data variation I did not test.
$ cd /work && python sweep.py
exit 0 after 51.3 s
[...]497          400.047       399.880           1.0       399.880
40  1  0.10    2      18.187           18.182   0.005  17.979  18.393            2.001         2.000           1.0         2.000
41  1  0.10    5      35.707           35.714  -0.008  35.450  35.962            4.998         5.000           1.0         5.000
42  1  0.10   10      52.630           52.632  -0.002  52.436  52.871            9.999        10.000           1.0        10.000
43  1  0.10   20      68.957           68.966  -0.009  68.806  69.101           19.992        20.000           1.0        20.000
44  1  0.10   50      84.751           84.746   0.006  84.669  84.839           50.022        50.000           1.0        50.000
45  1  0.10  100      91.743           91.743  -0.000  91.689  91.792           99.998        99.990           1.0        99.990
46  1  0.10  200      95.693           95.694  -0.001  95.667  95.718          199.970       199.980           1.0       199.980
47  1  0.10  400      97.799           97.800  -0.001  97.784  97.812          399.903       399.932           1.0       399.932
max abs gap 0.021
f 0.01 analytic k80 396.0
f 0.05 analytic k80 75.99999999999999
f 0.1 analytic k80 36.0
attached image /media/2026/10/ecdef000b9887e7ab8345e603ea3a174c19051d5e5b0111865726ebbc3df21e0.png (113.1 KB): Pooled share of exposures held by heavy users against multiplier k, for three heavy-user fractions. Simulation (200 replicates) and formula overlap.
attached data /media/2026/10/00eae836728a7829c53d6d51db3206e4d74a82096473922957907d0d676101ca.csv (3.2 KB): Full sweep table: pooled share, formula, gap, 95% replicate interval, per-person and median ratios, for m=5 and m=1.
Session 1 ended: succeeded Summary: The sweep ran: N=100,000, f of 1%, 5% and 10%, k from 2 to 200 plus an extra k=400, 200 replicates, seed 20261015 (+m). The simulated pooled share matches the formula in every cell (max gap 0.021 points). The 80% threshold lies outside the planned sweep for f=1% (k=396), so that planned failure condition triggered; I added k=400 to show it. Findings: ## Setup (Lab output, code in /work/sweep.py) Population 100,000. Heavy fraction f = 1%, 5%, 10%. Exposure is Poisson, mean m for light users, k*m for heavy users. Main run m=5, check run m=1. Seeds 20261015+m. 200 replicates per cell. k = 2, 5, 10, 20, 50, 100, 200, plus an extra k=400 (not in the plan, added because of the result below). ## Definitions (each counts exposures only, not attention or belief) - **Pooled share**: heavy users' exposures divided by all exposures. Formula: $$f k / (f k + 1 - f)$$ - **Per-person ratio**: mean exposures per heavy user divided by mean per light user. In this model it equals k by construction. - **Median ratio**: median of heavy users divided by median of light users (medians taken within each group, not the whole population). ## Results (m=5, simulated pooled share %, formula in brackets agrees to within 0.021 points) | k | f=1% | f=5% | f=10% | |---|---|---|---| | 2 | 1.98 | 9.52 | 18.18 | | 5 | 4.81 | 20.83 | 35.72 | | 10 | 9.17 | 34.48 | 52.63 | | 20 | 16.81 | 51.28 | 68.97 | | 50 | 33.56 | 72.46 | 84.74 | | 100 | 50.26 | 84.04 | 91.74 | | 200 | 66.89 | 91.32 | 95.69 | | 400 (extra) | 80.16 | 95.47 | 97.80 |  Full table with 95% replicate intervals, gaps, per-person and median ratios, both m values: [CSV](/media/2026/10/00eae836728a7829c53d6d51db3206e4d74a82096473922957907d0d676101ca.csv) ## Checks
Show 14 more lines
- Max absolute gap simulation versus formula over all 48 cells: 0.021 points. The 0.5 point success test passes. The 1 point failure test does not trigger.
- Pooled share does not depend on m (m=1 and m=5 agree within replicate noise). Intervals are wider at m=1.
- 80% threshold, closed form $$k = 4(1-f)/f$$: f=10% gives k=36, f=5% gives k=76, f=1% gives k=396. Simulation: at k=50 f=10% reads 84.7% (above 80), at k=50 f=5% reads 72.5% (below), at k=100 f=5% reads 84.0% (above). At k=400 f=1% reads 80.16%. I did not run a finer root search; the bracket agrees with the formula.
- **Plan failure condition triggered for f=1%**: the threshold needs k=396, outside the planned sweep (max 200). At k=200 the share is 66.9%.

## What is stable and what flips
- The pooled share is highly sensitive to k and f. "A small group holds 80%" needs k of about 36 at 10%, 76 at 5%, 396 at 1%. A headline share without k is not checkable.
- The per-person ratio is stable but equals k by design, so it carries no extra information here.
- The within-group median ratio also equals k (about 2 to 400) because heavy users form a separate group. So the median reading does not change the story in this toy model. Whole-population median is a different reading: with f below 50% it stays near the light-user value, so a "typical user" sees almost nothing. I did not tabulate that reading.

## Not tested
Real exposure is not two-point. Real data has continuous heavy tails, overlap between heavy users of news and of false news, and clustering. Grinberg et al.'s "80% of exposures in 1% of individuals" is an observed top-1% share, not a planted group, so it is not the same as my f. This model says nothing on attention or belief. No real data used.

App: none published.