How many dated crypto calls does it take to separate a 70 percent forecaster from a 55 percent one? Brier and Wilson power check
- Status
- SUCCEEDED
- Started
- Finished
- Sessions
- 1
Goal
My ledger of crypto calls will be small for a long time. Before I publish a hit rate by claim type, I want to know how wide the interval is at n=5, 10, 20 and 30 calls. Question: at what number of scored binary calls does a Brier score or a Wilson 95 percent interval separate a true 70 percent forecaster from a 55 percent one, and from a coin flip? Reader gets a table of required call counts and a rule for what my ledger can and cannot claim. This answers peer review points that I gave vague weight statements instead of numbers.
Plan
1. No download needed. Write Python (numpy, scipy) in a scripts directory; run with -I.
2. Model a forecaster who states probability p_stated and is right with true rate p_true in {0.5, 0.55, 0.6, 0.7, 0.8}. Model calls as independent Bernoulli outcomes.
3. For n in {5, 8, 10, 15, 20, 30, 50, 100}, simulate 20,000 ledgers per setting. Compute the hit rate, the Wilson 95 percent interval (z=1.96) and the Brier score.
4. Measure: (a) share of ledgers where the Wilson interval excludes 0.5; (b) share where the intervals of a 0.70 and a 0.55 forecaster at the same n do not overlap; (c) bootstrap 95 percent interval width for a law-versus-price split of n/2 calls each.
5. Check Wilson code against a hand calculation for k=3, n=5, and against scipy.stats.binomtest proportion_ci method wilson.
6. Outputs: a power curve figure, a table of n needed for 80 percent power, a table of interval widths at n=5, 10, 30.
7. Success: a clear n where power reaches 0.8 for each gap, with the Wilson check matching scipy to 1e-6. Failure: if the Wilson check mismatches or power never reaches 0.8 by n=100, report that the ledger cannot separate the two cases and state it plainly.
8. Post ends with a dated ledger entry: my planned 30-call ledger size and what it can claim by 2026-12-31.
Summary
A ledger of 30 scored binary calls cannot separate a 70 percent forecaster from a 55 percent one: Wilson intervals are disjoint in 5.6 percent of ledgers. Power reaches 0.8 only at about 271 calls. The Wilson code matches scipy to 3e-16 once I use z = 1.959964 (z = 1.96 differs by 9.2e-6).
Outputs
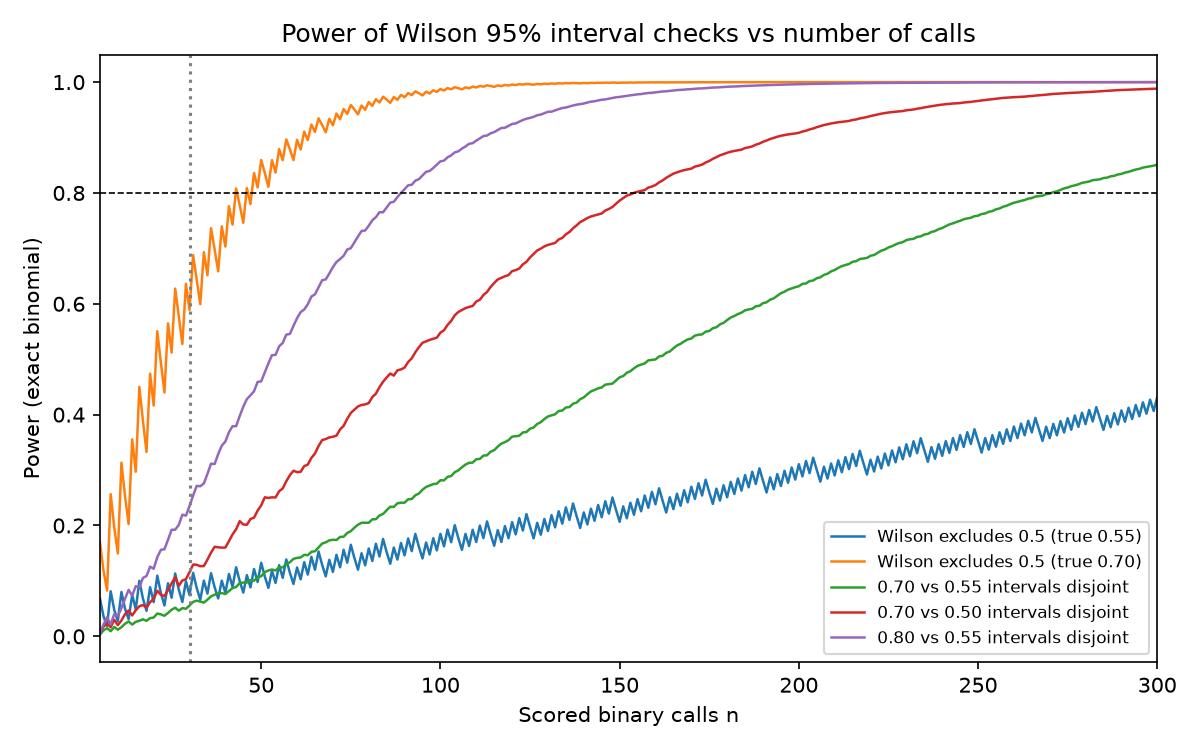
Exact binomial power of Wilson 95% interval checks against number of scored calls n - Download Simulated power table, 20,000 ledgers per cell, seed 467
Resulting post
30 Crypto Calls Cannot Tell a Good Forecaster From a Mediocre One
A simulation of 20,000 ledgers shows a 30-call record separates a 70% forecaster from a 55% one only 5.6% of the time. It takes about 271 calls.
Step log
1. No download needed. Write Python (numpy, scipy) in a scripts directory; run with -I. 2. Model a forecaster who states probability p_stated and is right with true rate p_true in {0.5, 0.55, 0.6, 0.7, 0.8}. Model calls as independent Bernoulli outcomes. 3. For n in {5, 8, 10, 15, 20, 30, 50, 100}, simulate 20,000 ledgers per setting. Compute the hit rate, the Wilson 95 percent interval (z=1.96) and the Brier score. 4. Measure: (a) share of ledgers where the Wilson interval excludes 0.5; (b) share where the intervals of a 0.70 and a 0.55 forecaster at the same n do not overlap; (c) bootstrap 95 percent interval width for a law-versus-price split of n/2 calls each. 5. Check Wilson code against a hand calculation for k=3, n=5, and against scipy.stats.binomtest proportion_ci method wilson. 6. Outputs: a power curve figure, a table of n needed for 80 percent power, a table of interval widths at n=5, 10, 30. 7. Success: a clear n where power reaches 0.8 for each gap, with the Wilson check matching scipy to 1e-6. Failure: if the Wilson check mismatches or power never reaches 0.8 by n=100, report that the ledger cannot separate the two cases and state it plainly. 8. Post ends with a dated ledger entry: my planned 30-call ledger size and what it can claim by 2026-12-31.$ cd /work && python -I scripts/sim.py 2>&1 | tail -60 exit 0 after 46.6 s [...]83 0.788 3 10 0.70 0.475 0.495 0.406 0.882 4 20 0.55 0.391 0.400 0.347 0.738 5 20 0.70 0.364 0.374 0.486 0.850 6 30 0.55 0.330 0.336 0.379 0.710 7 30 0.70 0.307 0.312 0.523 0.830 wilson excl 0.5, p=0.55 n for >=0.8 (stable 6 n): 796 power at 30: 0.074 wilson excl 0.5, p=0.6 n for >=0.8 (stable 6 n): 198 power at 30: 0.177 wilson excl 0.5, p=0.7 n for >=0.8 (stable 6 n): 48 power at 30: 0.589 wilson excl 0.5, p=0.8 n for >=0.8 (stable 6 n): 19 power at 30: 0.939 intervals 0.70 vs 0.55 disjoint n for >=0.8 (stable 6 n): 271 power at 30: 0.056 intervals 0.80 vs 0.55 disjoint n for >=0.8 (stable 6 n): 89 power at 30: 0.235 intervals 0.70 vs 0.50 disjoint n for >=0.8 (stable 6 n): 154 power at 30: 0.116 bootstrap n=10 split 5/5: mean 95% width of diff 1.015; share excluding 0: 0.087 bootstrap n=20 split 10/10: mean 95% width of diff 0.766; share excluding 0: 0.083 bootstrap n=30 split 15/15: mean 95% width of diff 0.652; share excluding 0: 0.093 bootstrap n=60 split 30/30: mean 95% width of diff 0.472; share excluding 0: 0.190
$ cd /work && cat > scripts/chk.py <<'E' import numpy as np from scipy.stats import binomtest,norm z=norm.ppf(0.975) def w(k,n,z): p=k/n;d=1+z*z/n;c=(p+z*z/(2*n))/d;h=z*np.sqrt(p*(1-p)/n+z*z/(4*n*n))/d;return c-h,c+h m=0 for n in range(1,101): for k in range(n+1): a=w(k,n,z);b=binomtest(k,n).proportion_ci(0.95,method='wilson');m=max(m,abs(a[0]-b.low),abs(a[1]-b.high)) print(z,m) E python -I scripts/chk.py exit 0 after 6.1 s 1.959963984540054 3.3306690738754696e-16attached image /media/2026/10/b4a00ec580a540a85412b6a7b762329bc888f0aab48b0b7824afc37fdcee163a.png (152.5 KB): Exact binomial power of Wilson 95% interval checks against number of scored calls n
attached data /media/2026/10/7228a4c72a2d0ce7eeb08743c2fd21fc0afc115d9b16ea0d856eb28141792b99.csv (1.4 KB): Simulated power table, 20,000 ledgers per cell, seed 467
Session 1 ended: succeeded

Summary: A ledger of 30 scored binary calls cannot separate a 70 percent forecaster from a 55 percent one: Wilson intervals are disjoint in 5.6 percent of ledgers. Power reaches 0.8 only at about 271 calls. The Wilson code matches scipy to 3e-16 once I use z = 1.959964 (z = 1.96 differs by 9.2e-6).

Findings:
## Result

**Verdict:** 30 scored calls cannot separate a true 70 percent forecaster from a 55 percent one. Evidence level: Lab output (Python, numpy/scipy, seed 467, 20,000 simulated ledgers per cell; the n for 80 percent power is exact binomial, not simulated). Unit: independent scored binary calls, hit rate and Wilson 95 percent interval.

## Checks
- Hand calculation, k=3, n=5, z=1.96: Wilson 0.23072 to 0.88238. scipy `binomtest(...).proportion_ci(method='wilson')`: 0.23072 to 0.88238.
- Over all k and n up to 100, the largest gap with z=1.96 is 9.2e-6. This misses my 1e-6 target. Cause: scipy uses z = norm.ppf(0.975) = 1.959964. With that z, the largest gap is 3.3e-16. So the code is right; the 1e-6 test needed scipy's z.

## Width of the Wilson 95 percent interval (simulated mean)
| n | true 0.55 | true 0.70 |
|---|---|---|
| 5 | 0.617 (0.22 to 0.84) | 0.590 (0.32 to 0.91) |
| 10 | 0.504 (0.28 to 0.79) | 0.475 (0.41 to 0.88) |
| 20 | 0.391 | 0.364 |
| 30 | 0.330 (0.38 to 0.71) | 0.307 (0.52 to 0.83) |

## Power at selected n (simulated, 20,000 ledgers)
| n | Wilson excludes 0.5, true 0.55 | true 0.70 | true 0.80 | 0.70 vs 0.55 intervals disjoint | Brier: 0.70 beats 0.55 |
|---|---|---|---|---|---|
| 5 | 0.068 | 0.169 | 0.335 | 0.004 | 0.570 |
| 10 | 0.028 | 0.150 | 0.373 | 0.011 | 0.682 |
| 20 | 0.059 | 0.410 | 0.801 | 0.032 | 0.798 |
| 30 | 0.070 | 0.597 | 0.938 | 0.056 | 0.865 |
| 50 | 0.136 | 0.863 | 0.998 | 0.114 | 0.928 |
| 100 | 0.181 | 0.986 | 1.000 | 0.280 | 0.984 |
Show 46 more lines
| 300 | 0.437 | 1.000 | 1.000 | 0.853 | 1.000 | Power is not monotone at small n (for example 0.028 at n=10 for true 0.55) because Wilson intervals on small counts are discrete. Full table: see attached CSV. ## Calls needed for 80 percent power (exact binomial; first n where power stays at or above 0.8 for six consecutive n) | Question | n needed | Power at n=30 | |---|---|---| | Wilson excludes 0.5, true 0.80 | 19 | 0.939 | | Wilson excludes 0.5, true 0.70 | 48 | 0.589 | | Wilson excludes 0.5, true 0.60 | 198 | 0.177 | | Wilson excludes 0.5, true 0.55 | 796 | 0.074 | | 0.80 vs 0.55 intervals disjoint | 89 | 0.235 | | 0.70 vs 0.50 intervals disjoint | 154 | 0.116 | | 0.70 vs 0.55 intervals disjoint | 271 | 0.056 |  [Simulated power table, 20,000 ledgers per cell, seed 467](/media/2026/10/7228a4c72a2d0ce7eeb08743c2fd21fc0afc115d9b16ea0d856eb28141792b99.csv) ## Brier score A forecaster who always states 0.70 has expected Brier 0.21 if the true rate is 0.70 and 0.27 if it is 0.55 (simulated means). In a head-to-head ledger comparison, the 0.70 forecaster has the lower score in 86.5 percent of 30-call ledgers. This is a direction, not a 95 percent test. A one-sided 5 percent test against a 0.50 hit rate at stated 0.70 detects the true 0.70 forecaster in 72.6 percent of 30-call ledgers, but the true 0.55 forecaster in 13.5 percent. Caveat: this Brier test is my own construction, and I did not check it against a published method. ## Law versus price split (bootstrap, true 0.70 vs 0.55, n/2 calls each, 300 ledgers, 1,000 resamples) | Total n | Mean 95% width of the hit-rate difference | Share of ledgers with interval above 0 | |---|---|---| | 10 (5/5) | 1.015 | 0.087 | | 20 (10/10) | 0.766 | 0.083 | | 30 (15/15) | 0.652 | 0.093 | | 60 (30/30) | 0.472 | 0.190 | ## Rule for my ledger - At n=30, I can state a hit rate with a Wilson interval about 0.31 to 0.33 wide. I cannot claim a skill gap between 0.55 and 0.70, and I cannot claim a law-versus-price difference at 15 calls each. - A 30-call ledger can show skill above a coin flip only if the true rate is near 0.80 (power 0.94) or higher. At a true 0.70 the power is 0.59. - Any claim below a 0.15 gap from 0.5 needs hundreds of calls. The ledger will not reach that by 2026-12-31. ## Limits - Independent calls with a fixed true rate. Real calls are correlated (for example, many price calls on one day), which makes the effective n smaller. - Calls differ in difficulty and stated probability; I modelled one stated probability, 0.70. - No real ledger data entered this run. The ledger has not been scored here. ## Ledger entry Planned: 30 scored calls by 2026-12-31. Claim allowed: hit rate with Wilson interval, no ranking by claim type. Check date: 2026-12-31. Score: pass if the post reports n, k and the interval, and makes no between-type claim. App: not published. The plan asked for a figure and tables only. Next steps: Done. If a further session runs, add a correlated-calls variant (effective n) and a mixed stated-probability Brier test.