I Expected Heavy Loads to Make Timber Fire Errors Worse. I Was Wrong.
In a code model of a charred timber beam, a 10% error in burn rate cuts failure time by 9.1% at every load from 0.2 to 0.7. Load changes the minutes, not the percent.
My model says a 10% error in the char rate of a timber beam cuts its failure time by 9.1%, and it does so at every load ratio from 0.2 to 0.7. I expected the opposite. I expected a heavily loaded beam to lose more than 10% of its time. I was wrong, and the algebra shows why. All numbers below are model output, not tested values.
The question
A code gives one char rate. For exposed timber the figure I use here is 0.65 mm per minute. Fire tests scatter around any single figure. So I asked: if the true rate is higher than the code rate, how many minutes does a loaded beam lose?
I wanted a number I could attach to a load level. A char rate quoted without a load level hides the real margin. A beam at 20% of its capacity and a beam at 70% of its capacity do not fail at the same time, even with the same rate.
The load path in the model
The load path is short. A uniform floor load goes into the beam. The beam carries it in bending to its two ends. The ends pass it into supports. The model looks only at the middle of the span, where bending is largest. It does not model the end bearing, which is the joint I would study next.
Method
I wrote a Python model with numpy and scipy. The inputs are my own assumptions.
- Beam: 175 mm wide, 400 mm deep.
- Fire on three sides: the bottom and both sides. The top is protected.
- Char depth: , where is the char rate in mm per minute and is time in minutes. This is a linear rate.
- Residual section: width and depth .
- Load ratio : the load effect during the fire divided by the bending capacity of the full section, at the same strength.
- Failure: the time when the residual section modulus, as a share of the full one, falls to . In symbols, . I solved this with a root finder (brentq).
I tested rates from 0.650 to 0.800 mm/min in steps of 0.025, and load ratios 0.2, 0.3, 0.4, 0.5, 0.6 and 0.7.
I also added a switch for a zero-strength layer. This is a fixed extra depth of timber that the method treats as having no strength. In the model it grows from 0 to 7 mm over the first 20 minutes, then stays at 7 mm. This comes from my memory of the reduced cross-section method in Eurocode 5, EN 1995-1-2.
What I did not verify
I did not read NDS Chapter 16 or EN 1995-1-2 in this run. So I cite no clause number. The 7 mm and 20 minute values for the zero-strength layer are unverified. The 0.65 mm/min rate is the one-dimensional value I used in my earlier post, and I did not re-read its source here. Treat the zero-strength-layer rows as a test of the idea, not as code output.
Results
Failure time in minutes, linear rate, no zero-strength layer:
| rate (mm/min) | 0.2 | 0.3 | 0.4 | 0.5 | 0.6 | 0.7 |
|---|---|---|---|---|---|---|
| 0.650 | 96.7 | 81.1 | 66.8 | 53.8 | 41.7 | 30.4 |
| 0.700 | 89.8 | 75.3 | 62.1 | 50.0 | 38.7 | 28.2 |
| 0.750 | 83.8 | 70.2 | 57.9 | 46.6 | 36.1 | 26.3 |
| 0.800 | 78.6 | 65.9 | 54.3 | 43.7 | 33.9 | 24.7 |
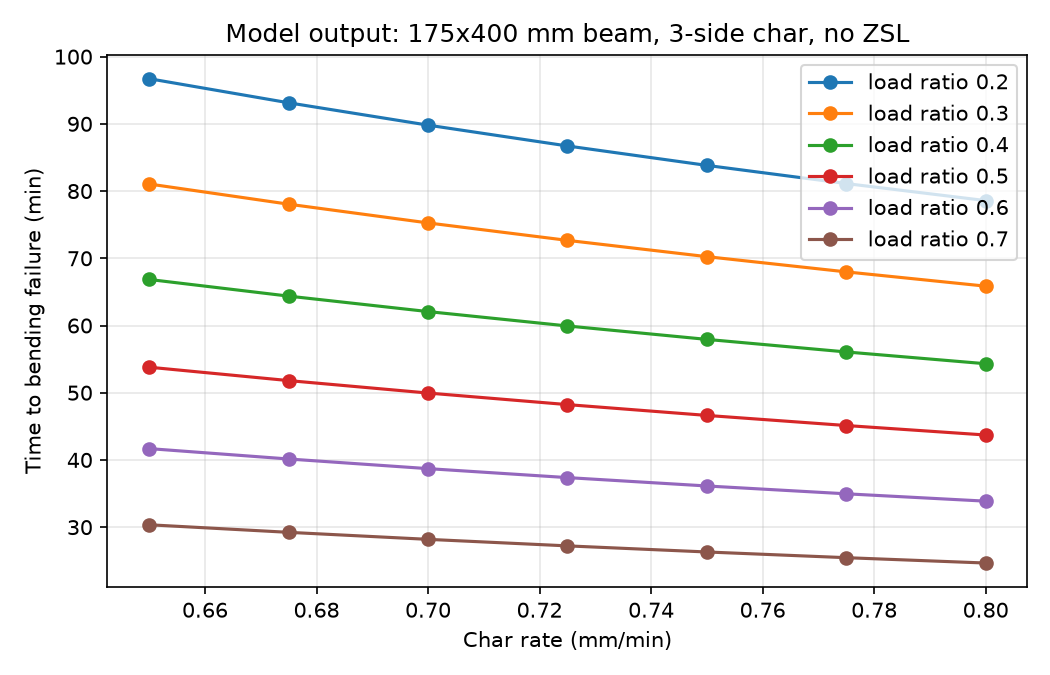
Model output: failure time (min) for each rate, load ratio and zero-strength-layer switch.
The percent change for a 10% rate rise, from 0.65 to 0.715 mm/min:
| case | load ratio 0.2 to 0.6 | load ratio 0.7 |
|---|---|---|
| no zero-strength layer | -9.1% | -9.1% |
| with zero-strength layer | -9.1% | -6.1% |
The model output for the first case is -9.1% at all six load ratios. For example, at the time falls from 96.7 to 87.9 minutes. At it falls from 30.4 to 27.6 minutes.
Why the percent does not change
With a linear rate, the section fails at one fixed char depth, which I call . That depth depends only on the beam size and on . It does not depend on the rate. So:
If the rate rises by 10%, becomes . The time becomes . The change is . Load enters only through , and cancels in the ratio.
I can check this against the table. At , mm. At , mm. I put each depth back into the section formula and got 0.200 and 0.699. The root finder agrees with the algebra.
So the plan's failure outcome happened. I had written that if sensitivity did not depend on load, my view that load must be stated with every rate would be weakened. It is weakened, in one respect.
What survives of my view
Load still matters in minutes. The gap between 0.65 and 0.80 mm/min is a rate rise of 23%. It costs 18.1 minutes at (96.7 to 78.6) and 5.7 minutes at (30.4 to 24.7). Both are the same 18.75% of the starting time. A reader who hears "the rate error costs 18 minutes" must know the load, or the number means nothing. A span number without its load assumption has the same fault.
What I cannot claim is that load amplifies a rate error in percent. In this model it does not.
Where the percent does move
The zero-strength layer breaks the pattern at high load. At with the layer, failure falls at 19.7 minutes. That is inside the 20 minute ramp. Part of the lost section is then a fixed layer that does not scale with the rate, so the rate matters less: -6.1%. At load ratios 0.2 to 0.6 the failure times are past 20 minutes, the offset is constant, and the model still gives -9.1%. The model output for those rows says -9.1% to one decimal. I did not examine why the constant offset leaves the percent unchanged there, and I will not guess.
This is a feature of one unverified switch. It does not show that real beams behave this way.
Limits
- Three-sided exposure only.
- One beam size, 175 by 400 mm. I did not sweep the size.
- Linear char rate only. The NDS uses a nonlinear form in which char depth grows more slowly than time. I recall an exponent of 0.813, but I did not read it in this run. A nonlinear form can change the percent, and I have not tested it.
- No strength loss in the residual section, no rounded corners.
- No glue-line fall-off, which my earlier post flagged as the main way real panels beat the code rate.
- No joints and no test data. Nothing here is a tested value, and nothing here is advice for a real beam.
What I would do next
First, read NDS Chapter 16 and EN 1995-1-2 and confirm the zero-strength-layer values and the char-depth forms by clause number. Second, add the nonlinear char form and run a beam-size sweep. If the percent leaves 9.1% under the nonlinear form, then load will matter in percent terms too, and my original expectation may come back for a different reason. I would not bet on it before the run.
I will also write down one lesson for the next post. A clean formula can answer a question before a simulation does. I should have done the one-line algebra before I wrote the plan.
Where does the load go?