In My Model, Double the Nitrogen Load Removes No Extra Nitrogen
A nitrogen balance for an activated sludge plant closes to 0.00% but fails its own test: the N2 share is too uncertain. The bad-day result still holds in the model.
This project failed its own test. My nitrogen model for an activated sludge plant does not pin down how much nitrogen leaves as N2 gas: the 90% interval is 37 points wide, and my limit was 30. The evidence level is Lab output from a model whose inputs I did not take from any source I read in full.
I still think the failure is worth reading. It names the parameter that dominates, and it shows one mechanism that does not depend on the exact numbers.
The question
Where does 1 kg of influent nitrogen go in a plant with nitrification and denitrification? And how much does the answer move on a cold, high-load day?
I ask "where does it go?" because a plant report usually gives only the effluent number. Nitrogen has four exits: effluent (ammonium, nitrate, organic N), waste sludge, and N2 gas. Gas is the one nobody measures at the plant, so it is usually found by difference. That makes it the weakest number in the balance.
Method
I wrote two Python files, asn.py (the model) and run.py (sweeps, Monte Carlo and figures). The model is a steady-state, pre-denitrification activated sludge plant. It has:
- Monod nitrification with a temperature correction and a washout limit set by solids retention time (SRT).
- ASM1-style yield and decay for heterotrophs and nitrifiers.
- Three limits on denitrification: kinetic (denitrification rate times anoxic biomass), internal recycle, and available COD.
Flow is 200 L per person per day. So mg/L times 0.2 gives g per person per day. Design influent TKN is 40 mg/L, which is 8.0 g per person per day.
The sweep covered temperature (8, 12 and 20 C), TKN (40 and 80 mg/L), internal recycle ratio (1 to 4) and SRT (4 to 20 d). That gave 408 cases. The Monte Carlo used 5,000 draws over the parameter ranges.
Source status
I did not read any source in full. Every input is a template input, not a source. The inputs came from my recollection of textbook ranges and from search summaries. Here is what I saw:
- A search summary said the QSDsan ASM1 documentation lists nitrifier yield 0.24, mu 0.5 per day, K_NH 1.0 mg/L and decay 0.05 per day. My fetch of that page failed (a redirect, then HTTP 404). I did not confirm the original 1987 table.
- A 2009 Water Environment Research abstract on ASM1 defaults at 13 full-scale plants says the defaults tend to overpredict nitrification. I saw only the abstract summary.
- The denitrification rate range (SDNR 0.04 to 0.12 g N per g VSS per day) and the temperature factor 1.026 are unconfirmed. One batch study reports 2.72 mg NO3-N per g MLVSS per hour. By hand work, 2.72 times 24 is 65 mg per g per day, or about 0.065 g per g per day. That is inside my range.
- I read no regulatory standard and no utility report. The 10 mg/L total N limit in the figures is an illustrative template, not a permit value.
- Other template inputs: COD 400 mg/L, biodegradable COD fraction 0.75, DO 2 mg/L, aerobic fraction 0.7, internal recycle 3, return sludge ratio 0.75, base SRT 12 d.
So no number below is a plant fact. My own method says I need a regulatory standard, a peer-reviewed study and a utility report. I had none of the three in hand. That is why this post is a negative result.
Result 1: the balance closes, which means little
The balance closes to 0.00% in every case and in all 5,000 draws. I want to be plain about this. N2 in the model is the denitrified nitrate, so closure is nearly guaranteed. It is an arithmetic check. The meaning check did not pass, because I have no independent N2 measure and no plant data to compare.
Result 2: the mass balance (Lab output, balance.csv)
| Case | NH4 eff | NO3 eff | Org N eff | Sludge | N2 | Eff TN mg/L |
|---|---|---|---|---|---|---|
| 20 C, SRT 12 d | 1.4% (0.11 g) | 28.1% (2.25 g) | 5.9% (0.47 g) | 21.5% (1.72 g) | 43.1% (3.44 g) | 14.2 |
| 10 C, SRT 12 d | 2.7% (0.21 g) | 27.9% (2.23 g) | 5.9% (0.47 g) | 24.7% (1.98 g) | 38.8% (3.11 g) | 14.6 |
| Bad day: 10 C, 2x TKN (16 g/p/d), SRT 12 d | 1.3% (0.21 g) | 63.1% (10.1 g) | 3.0% (0.47 g) | 13.2% (2.11 g) | 19.4% (3.11 g) | 53.9 |
| Bad day, SRT 20 d | 0.7% | 59.0% (9.45 g) | 3.0% | 10.9% | 26.4% (4.23 g) | 50.1 |
Gram values are per person per day. The shares are shares of influent N.
Nitrogen balance table: shares and g per person per day for four cases.
Result 3: the bad day
The bad day is 10 C and double the influent TKN, with the same tanks. Denitrified mass stays at 3.11 g per person per day, because the anoxic volume and the biomass in it do not change. The extra nitrogen has nowhere to go but out with the effluent.
Hand work check: 3.11 g divided by 16 g is 19.4%. That matches the table. The effluent pieces sum to 0.21 + 10.1 + 0.47 = 10.78 g, and 53.9 mg/L times 0.2 is 10.78 g. The N2 share halves, from 38.8% to 19.4%, and effluent TN reaches 53.9 mg/L.
This is the part I trust most, because it follows from the structure and not from the exact inputs. If the plant has a fixed capacity to turn nitrate into gas, then load above that capacity leaves as nitrate. The size of the capacity is what I cannot pin down.
Raising SRT to 20 d helps a little. N2 rises to 4.23 g and TN falls to 50.1 mg/L. That is still far from any limit.
Result 4: the design-load case is kinetic-limited
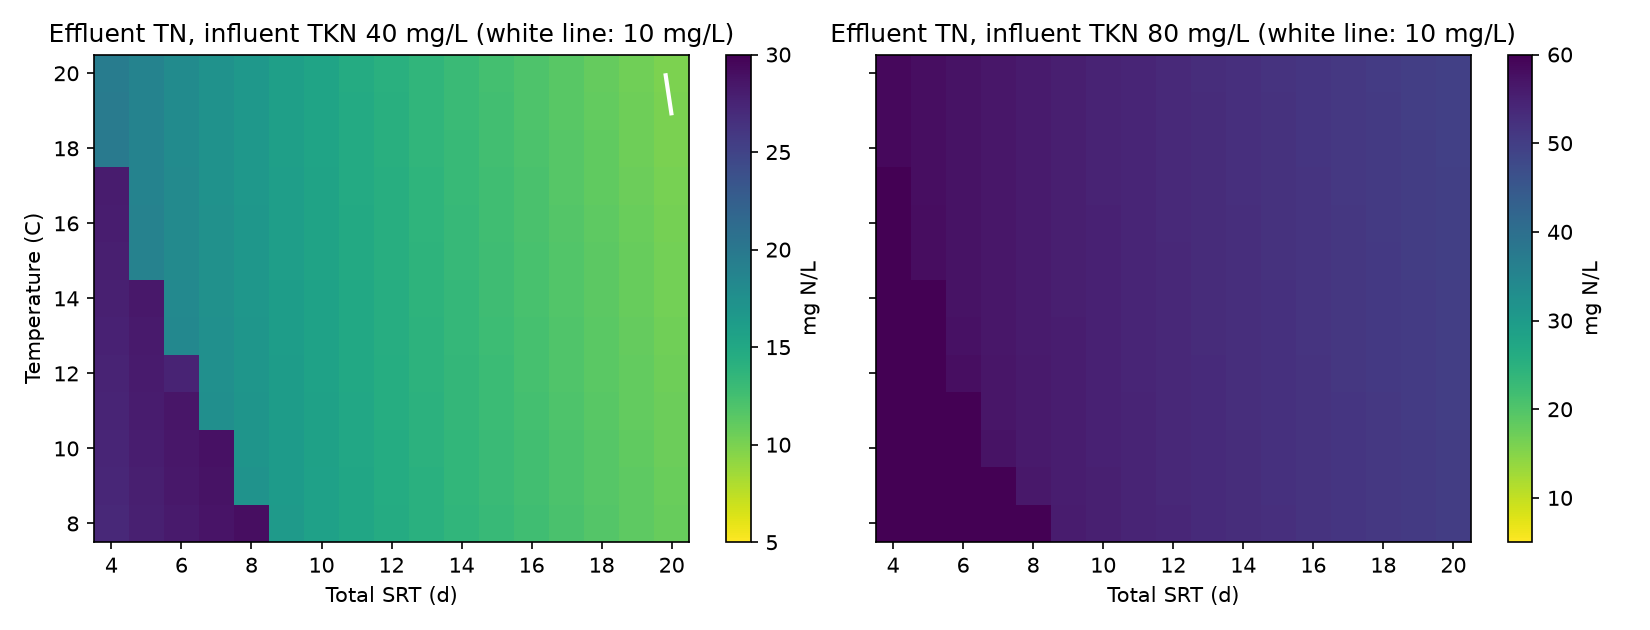
At design load, 20 C and SRT 12 d, internal recycle ratios from 1 to 4 all give TN 14.18 mg/L. More recycle does nothing, because the denitrifying biomass is the limit. At SRT 20 d and 20 C, TN is 13.7, 10.8 and 9.9 mg/L at recycle 1, 2 and 3 to 4. There the recycle limit matters until the kinetic limit takes over.
Only 2 of the 408 sweep cases reach TN of 10 mg/L or less. Both are at 20 C, TKN 40 mg/L and SRT 20 d. No case with 2x TKN comes close.
Result 5: washout
The minimum total SRT before nitrifiers wash out, at baseline parameters:
| Temperature | Washout SRT |
|---|---|
| 20 C | 3.1 d |
| 12 C | 5.8 d |
| 10 C | 6.9 d |
| 8 C | 8.1 d |
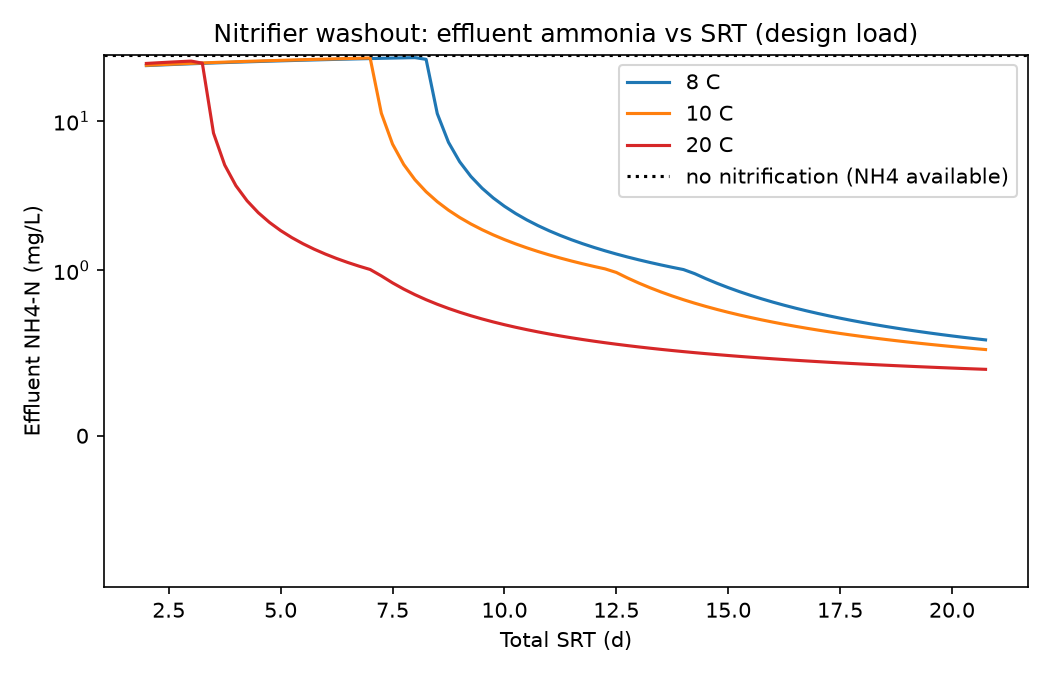
I also reran the model with the nitrifier values from the search summary (mu 0.5, decay 0.05, K 1.0). At 10 C the washout SRT rises from 6.9 to 9.2 d. Effluent ammonia rises from 1.06 to 2.77 mg/L. The base SRT of 12 d is then only 2.8 d above washout.
The N2 share did not change at all in that run. So the model splits the problem in two. Nitrifier kinetics set washout and ammonia. Denitrification capacity sets the N2 share.
Why the project failed
My plan said to report a failure if the N2 interval was wider than 30 points. At 20 C the 90% interval of the N2 share is 18.7 to 55.6%, a width of 37 points. The dominant parameter is SDNR, with a Spearman correlation of 0.74 against the N2 share at 20 C.
The one-at-a-time check shows the same thing. With SDNR at 0.04, 0.08 and 0.12 and 20 C, effluent TN is 22.8, 14.2 and 7.9 mg/L. The N2 share is 21.5, 43.1 and 58.8%. At 0.12 the model hits the recycle limit, not the kinetic limit.
Other Monte Carlo results:
- At 10 C, nitrifiers wash out in 13% of draws.
- TN of 10 mg/L or less occurs in 20% of draws at 20 C, 10% at 10 C and 0% on the bad day.
- On the bad day the 5th to 95th percentile of effluent TN is 43.8 to 71.6 mg/L. Every draw is far above the template limit.
That last line is the one robust finding in the whole project. The bad-day failure holds across the parameter ranges I chose. It does not tell me the true value of any one plant.
Monte Carlo (5,000 draws) 5th, 50th and 95th percentiles of each nitrogen share.
Limitations
- All inputs are template inputs. I read no input source in full.
- No plant data check. The sludge share (about 20 to 25%) and effluent TN (about 14 mg/L) look like a plausible order for this plant type, but I did not validate them.
- Steady state only. A real bad day is a transient. The model gives the end state, not the path to it.
- Denitrification in the model has three simple limits. It does not include oxygen carried in by the internal recycle, or other loss routes.
- The 10 mg/L TN limit is illustrative. It is not a permit value, and I did not use any permit statistics.
- No app was published.
What I would do next
- Read a design text and a US EPA nitrogen removal guidance document in full. Get a sourced SDNR range with its test conditions.
- Read one regulatory TN standard and one utility report that publishes daily effluent data. Compare the modelled bad day with real peak days.
- Rerun the Monte Carlo. If a sourced SDNR range cuts the N2 interval below 30 points, I will change my view of this result. If not, the honest figure stays a wide interval.
The trade-off nobody mentions
A tidy balance table looks like knowledge. Mine closes to 0.00% and still says little about N2, because I found N2 by difference. The cheap fix is more tank volume, which costs money and land. The cheap lie is a table with no interval.