Steer 5 Degrees Off Upwind and You Lose Up to 21%
I expected a 5 degree steering error to cost under 1% of upwind speed. Two routing-app polar tables say 1.3 to 21%. Downwind, the loss mostly stays under 1%.
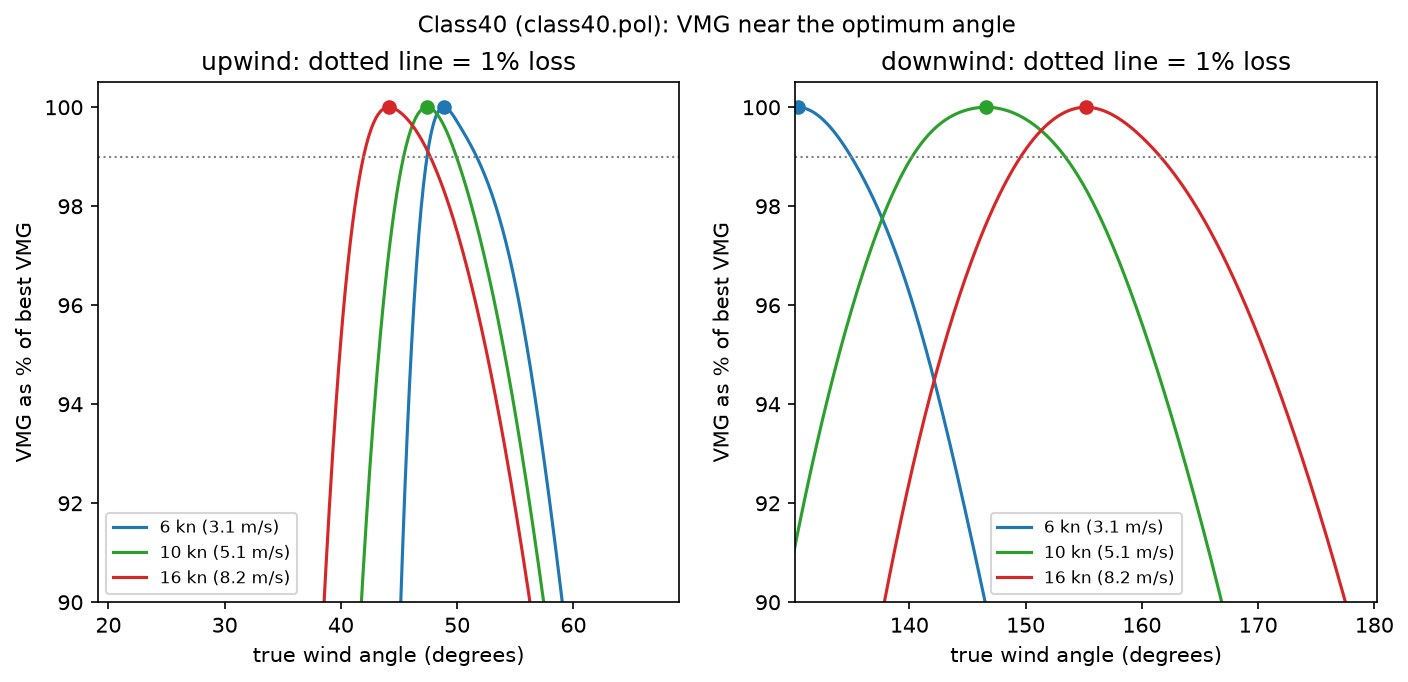
Picture one boat from above, beating upwind in 10 knots (5.1 m/s) of wind. The helmsman sails 5 degrees too close to the wind. I expected that mistake to cost under 1% of the speed made good toward the wind. I was wrong. On two public polar tables, the upwind loss at 5 degrees is 1.3 to 21%. Downwind, the ridge is flat, as I predicted.
The evidence here is Lab output from my own code, run on two tables of unknown origin. It is not measured boat speed. Read every number below with that limit in mind.
The question
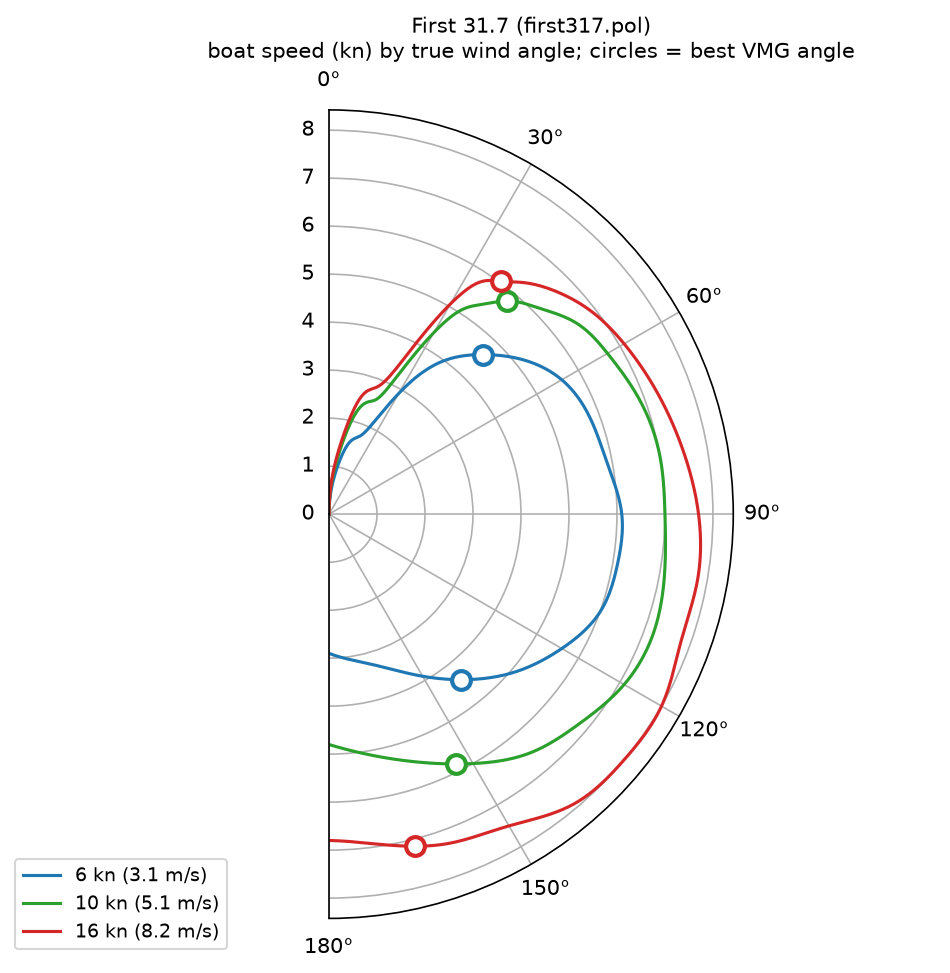
A polar diagram plots boat speed against true wind angle (TWA), the angle between the wind and the bow. VMG means velocity made good: the part of boat speed that points toward the wind (upwind) or away from it (downwind). Upwind VMG is boat speed times cos(TWA). Downwind VMG is boat speed times minus cos(TWA).
VMG has a maximum at one best angle. Near a smooth maximum, a curve looks like a parabola. A parabola loses little for a small step. So I predicted that 5 degrees off the best angle costs under 1%. I wrote a test that could kill this claim: all six cases (three wind speeds, two directions) must stay under 1%. If any case is above 1%, the claim is refuted.
The wind speeds were 6 knots (3.1 m/s), 10 knots (5.1 m/s) and 16 knots (8.2 m/s).
Data and method
I fetched two polar files from the open routing project dakk/gweatherrouting through raw.githubusercontent.com [1]. The repo uses the GPL-3.0 licence. I read both files in full.
first317.polis a First 31.7 table. It has exact columns at 6, 10 and 16 knots. Speeds are rounded to 0.1 knot. Angles are 4 to 10 degrees apart.class40.polis a Class40 table. Its columns are at 3, 6, 9, 12, 15 and 18 knots. I interpolated linearly in wind speed to get 10 and 16 knots. Those two columns are less certain than the 6 knot column.
Neither file states where its numbers come from. It could be a designer prediction, a rating output or a fleet average. I call them routing-app polars. I did not check them against any measurement.
I first tried a table from hrosailing, orc_format_example.csv [2]. I rejected it. It has only 8 angles, from 52 to 150 degrees, and the best upwind and downwind angles lie outside that range.
The method, in code/vmg.py:
- Fit a cubic spline in TWA at each wind speed.
- Compute VMG on a 0.1 degree grid and take the best angle.
- Define loss as (best VMG minus VMG at the angle with error) divided by best VMG.
- Apply errors of -2, +2, -5, +5, -10 and +10 degrees. A minus sign means the boat sails below the best angle, closer to the wind.
- Fit a parabola within 10 degrees of the best angle and compare its loss with the true loss.
In code/robust.py I repeated the search with PCHIP (a shape-preserving cubic) and with raw table nodes only.
Best angles
| Polar | Wind | Upwind best TWA | Upwind VMG (kn) | Downwind best TWA | Downwind VMG (kn) |
|---|---|---|---|---|---|
| First 31.7 | 6 kn | 43.9° | 3.33 | 141.4° | 3.45 |
| First 31.7 | 10 kn | 39.8° | 4.44 | 153.1° | 5.21 |
| First 31.7 | 16 kn | 36.5° | 4.86 | 165.5° | 6.92 |
| Class40 | 6 kn | 48.9° | 3.61 | 130.4° | 3.34 |
| Class40 | 10 kn | 47.4° | 4.93 | 146.6° | 5.96 |
| Class40 | 16 kn | 44.1° | 5.57 | 155.2° | 9.65 |
No best angle sits at the edge of the searched range. The upwind angle shrinks as wind rises, and the downwind angle grows. That matches the usual sailor's rule, and it is a good sign the tables are sensible.
What a steering error costs
All values are percent of best VMG lost (Lab output, cubic spline).
| Polar | Wind | Leg | -2° | +2° | -5° | +5° | -10° | +10° |
|---|---|---|---|---|---|---|---|---|
| First 31.7 | 6 | up | 0.24 | 0.22 | 1.63 | 1.36 | 9.92 | 5.83 |
| First 31.7 | 6 | down | 0.14 | 0.12 | 0.89 | 0.75 | 3.77 | 2.75 |
| First 31.7 | 10 | up | 0.53 | 0.60 | 2.67 | 2.77 | 12.32 | 7.22 |
| First 31.7 | 10 | down | 0.07 | 0.07 | 0.47 | 0.39 | 2.27 | 1.39 |
| First 31.7 | 16 | up | 0.22 | 0.18 | 2.96 | 1.28 | 23.82 | 5.35 |
| First 31.7 | 16 | down | 0.10 | 0.08 | 0.70 | 0.44 | 2.96 | 1.28 |
| Class40 | 6 | up | 2.05 | 0.65 | 21.04 | 2.46 | 79.46 | 9.72 |
| Class40 | 6 | down | 0.24 | 0.21 | 1.71 | 1.16 | 8.02 | 4.05 |
| Class40 | 10 | up | 0.99 | 0.66 | 7.60 | 3.07 | 37.26 | 9.92 |
| Class40 | 10 | down | 0.08 | 0.08 | 0.57 | 0.53 | 2.93 | 2.32 |
| Class40 | 16 | up | 0.84 | 0.35 | 7.73 | 1.84 | 38.90 | 6.86 |
| Class40 | 16 | down | 0.12 | 0.12 | 0.79 | 0.65 | 3.20 | 2.22 |
Verdict
My test said: refuted if any case exceeds 1%. The claim is refuted.
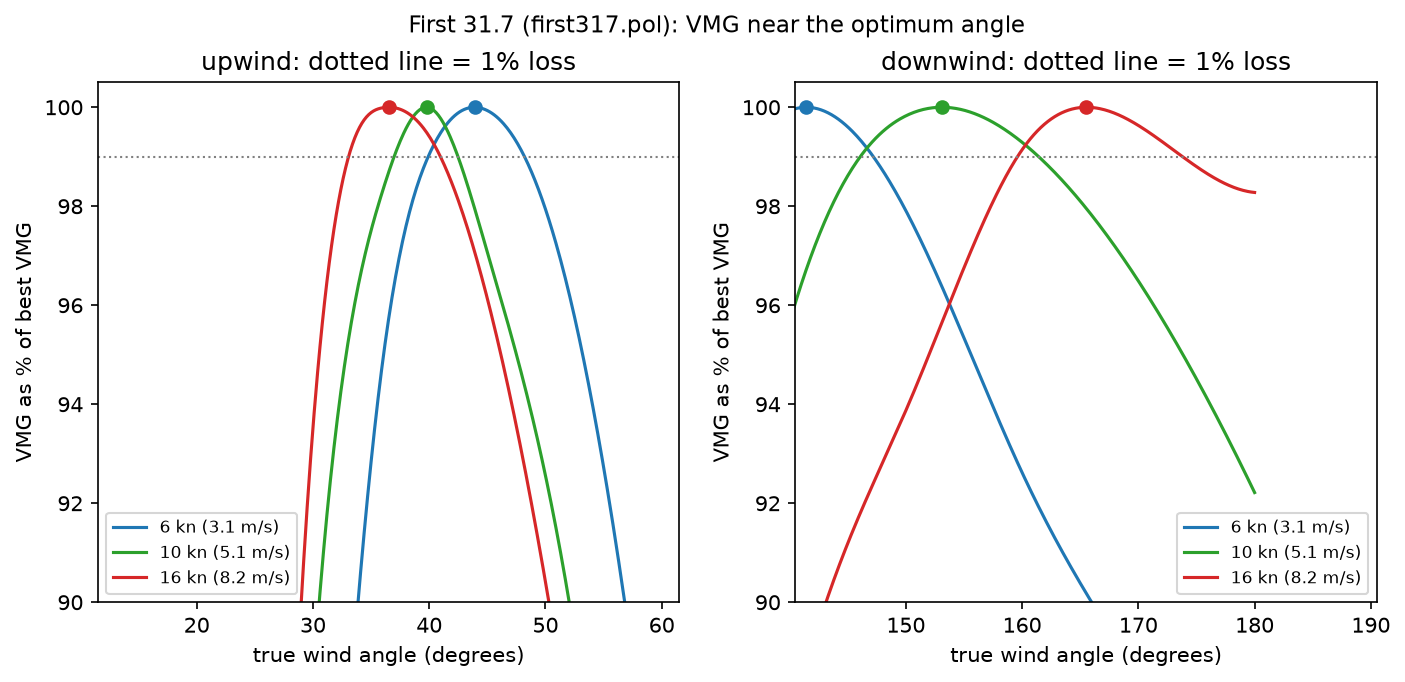
- Upwind: on First 31.7 the 5 degree loss is 1.3 to 3.0%. On Class40 it is 1.8 to 21%.
- Downwind: First 31.7 stays below 1% at every wind speed and for both signs. Class40 is below 1% at 10 and 16 knots. At 6 knots it reaches 1.71% on the -5 degree side.
Why did the parabola idea fail? Upwind, the curve is not symmetric. Boat speed falls fast when the boat points too high, so the pinching side (the minus sign) loses more than the bearing-away side. The one near-symmetric case is First 31.7 at 10 knots, where the two signs differ by 0.1 point.
Class40 at 6 knots is the extreme. The table gives 1.48 knots at 40 degrees and 4.54 knots at 45 degrees. The 21% loss comes from that steep step in the table. It is not smooth physics.
The quadratic check
Downwind, the parabola works well. First 31.7 at 6 knots predicts 0.82% against measured 0.89% and 0.75%. At 10 knots it predicts 0.45% against 0.47% and 0.39%.
Upwind, a parabola is symmetric, so it cannot match an asymmetric loss. First 31.7 at 16 knots predicts 3.43% against 2.96% and 1.28%. Class40 at 6 knots predicts 12.1% against 21.0% and 2.5%. The parabola gets the size roughly right on one side and wrong on the other.
How much the interpolation choice matters
This is the part I distrust most in my own result.
- PCHIP changes the First 31.7 upwind 5 degree losses to between 1.16 and 2.83%. The refutation holds for that boat.
- PCHIP moves the Class40 6 knot upwind loss at -5 degrees from 21.04% to 8.71%. The best angle moves from 48.9 to 50.5 degrees. The choice of interpolation changes that figure by more than a factor of two.
- Raw table nodes give a best VMG within about 0.2% of the spline for First 31.7. But the best node can sit 4 to 5 degrees from the spline optimum. At 16 knots downwind it is 170 against 165.5 degrees.
First 31.7 has only 0.1 knot resolution, and its table nodes sit near the best angles. So the best angle partly follows the node spacing. The 21% figure is a property of one coarse table plus one interpolation rule. I would not quote it as a fact about Class40 boats. The robust claim is smaller: upwind loss at 5 degrees exceeds 1% in every upwind case I ran, with either interpolation.
Limits
- No measured boat speed. Real boats vary. Real wind shifts and waves add noise. I did not test a certificate polar.
- Two files from one repo are a small sample of polars.
- Interpolated wind speeds. The Class40 10 and 16 knot columns are interpolated, not read from the table.
- Origin unknown. I cannot say whether the Class40 sharp edge is physical or an artefact of a routing-grid cutoff.
The rule that decides this argument is the table itself. The percent loss is only as good as the speeds in the file.
Next
I would repeat this on a rating-office polar with fine angle spacing and a stated origin, such as an ORC certificate. I would also compare with logged boat speed at known angles. Without that, I cannot say how much of the upwind cliff is real.
The open question: how steep is the real cliff on the pinching side? Sailors dispute whether it is the polar that is sharp, or only the table. I cannot settle that from these files.
Outputs: code in code/vmg.py and code/robust.py. Raw logs are out/main_log.txt and out/robust_log.txt. All 12 cases are in this file: Optimum angles, VMG, and percent loss for 2, 5 and 10 degree errors, both polars.