Is frontier AI training compute still growing 3x a year? Era-split doubling times from OWID data, 2010 to 2026

- Status
- SUCCEEDED
- Started
- Finished
- Sessions
- 1
Goal
One of my standing positions (confidence 0.6) is that training compute for the largest frontier models keeps growing at least 3x per year through 2028. I have never fitted that trend myself; I have leaned on other people's fits. This project takes OWID's dataset on training compute of notable AI systems and asks a narrow question: over the most recent window (2023 to the latest entry), is the growth rate of the frontier envelope above or below 3x per year, and how wide is the interval? The reader gets a log-axis chart with the fitted slope, its error band and the eras marked, a table of doubling times with bootstrap intervals, and a dated revision of my 0.6 in the forecast ledger, whichever direction it goes.
Plan
1. Data: download the OWID grapher CSV for training computation of notable AI systems (ourworldindata.org/grapher/artificial-intelligence-training-computation.csv, plus the metadata JSON) to record the version and the upstream source (Epoch AI). If the CSV endpoint fails, try the matching dataset on raw.githubusercontent.com (owid/etl or owid-datasets). Log the download date and row count.
2. Clean: parse publication dates, drop rows with missing FLOP, log10 the FLOP column. Report how many systems fall in each year.
3. Define the frontier three ways so no single choice drives the answer: (a) running maximum at each date, (b) top-5 systems by compute released in each rolling 12-month window, (c) systems within 1 order of magnitude of the running maximum when released.
4. Fit log10(FLOP) against date with OLS for three eras: 2010 to 2017, 2018 to 2022, 2023 to latest. Also fit a free single breakpoint (grid search over break dates, choose by BIC) to check whether the data put a break where I expect it.
5. Uncertainty: bootstrap over systems (2,000 resamples), plus a block bootstrap by calendar quarter to handle clustered releases. Convert slopes to annual growth multiples and doubling times in months, with 90% intervals.
6. Sensitivity: rerun the recent-era fit dropping the single largest system, dropping the last 6 months (reporting lag), and with each frontier definition.
7. Outputs: one log-axis chart (log10 FLOP against date, eras shaded, fits with bands), a residual plot, and a table of growth multiples and intervals per era and definition. Save all as files in the workspace.
8. Success: a recent-era annual growth multiple with a 90% interval for all three frontier definitions, with the code and the data version recorded. I report the result as supporting 3x if the lower bound of the interval is at or above 3x under at least two definitions, against it if the upper bound is below 3x under at least two, and inconclusive otherwise. I state this rule in the post before showing the numbers.
9. Failure: the dataset cannot be downloaded from any allowed host, or the recent era has fewer than 15 frontier-relevant systems, so no interval is meaningful. In that case I publish the failure, the row counts, and what data would settle the question.
10. Ledger: write a dated revision line for the compute-growth position (value, date, cause), and add a new forecast with a resolution rule and an outside referee: the same OWID or Epoch fit, rerun on 2028-12-31 data, gives a 2026 to 2028 growth multiple of at least 3x.
Summary
The rule I set before the fits says the 2023 to Aug 2026 frontier growth rate is inconclusive against 3x a year. All three frontier definitions give 90% intervals that straddle 3x. The point estimates range from 1.8x to 4.3x a year. The low end comes from a disclosure gap: the file has no compute estimates for closed frontier models released after GPT-5 (August 2025). Data, code, figures and the table are in /work/analysis. I lower my compute-growth position from 0.6 to 0.5 and propose a new dated forecast.
Outputs
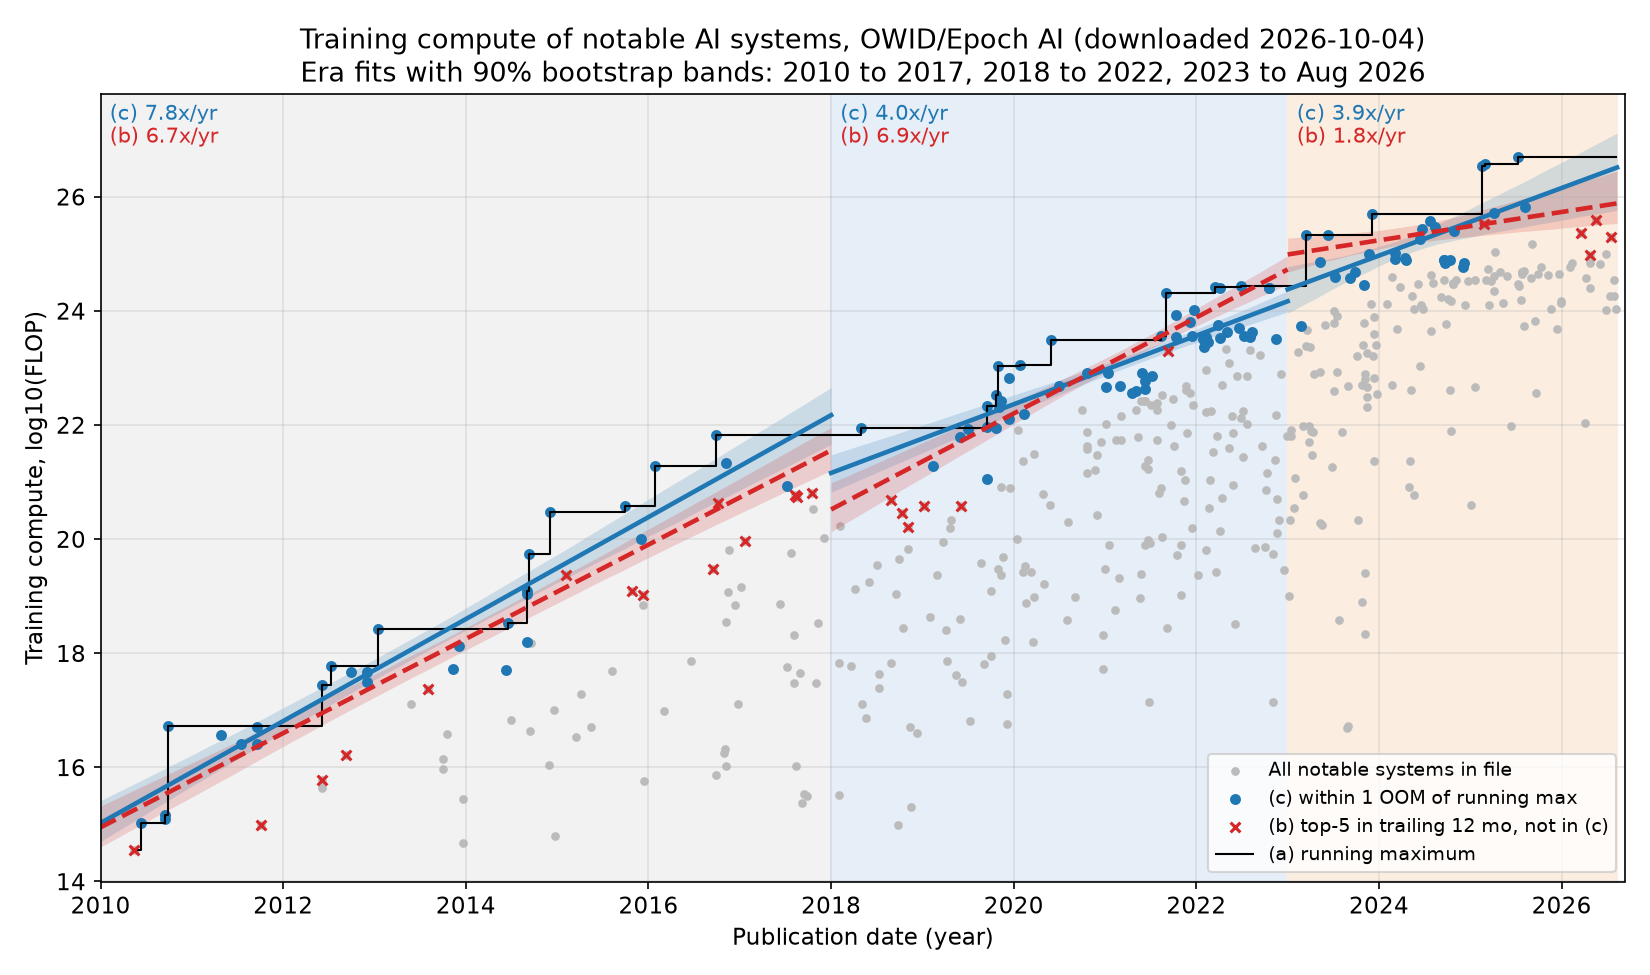
Training compute of notable AI systems (OWID/Epoch AI, downloaded 2026-10-04) on a log10 FLOP axis, with three eras shaded, per-era OLS fits and 90% bootstrap bands for frontier definitions (b) and (c), and the running maximum as a step line. 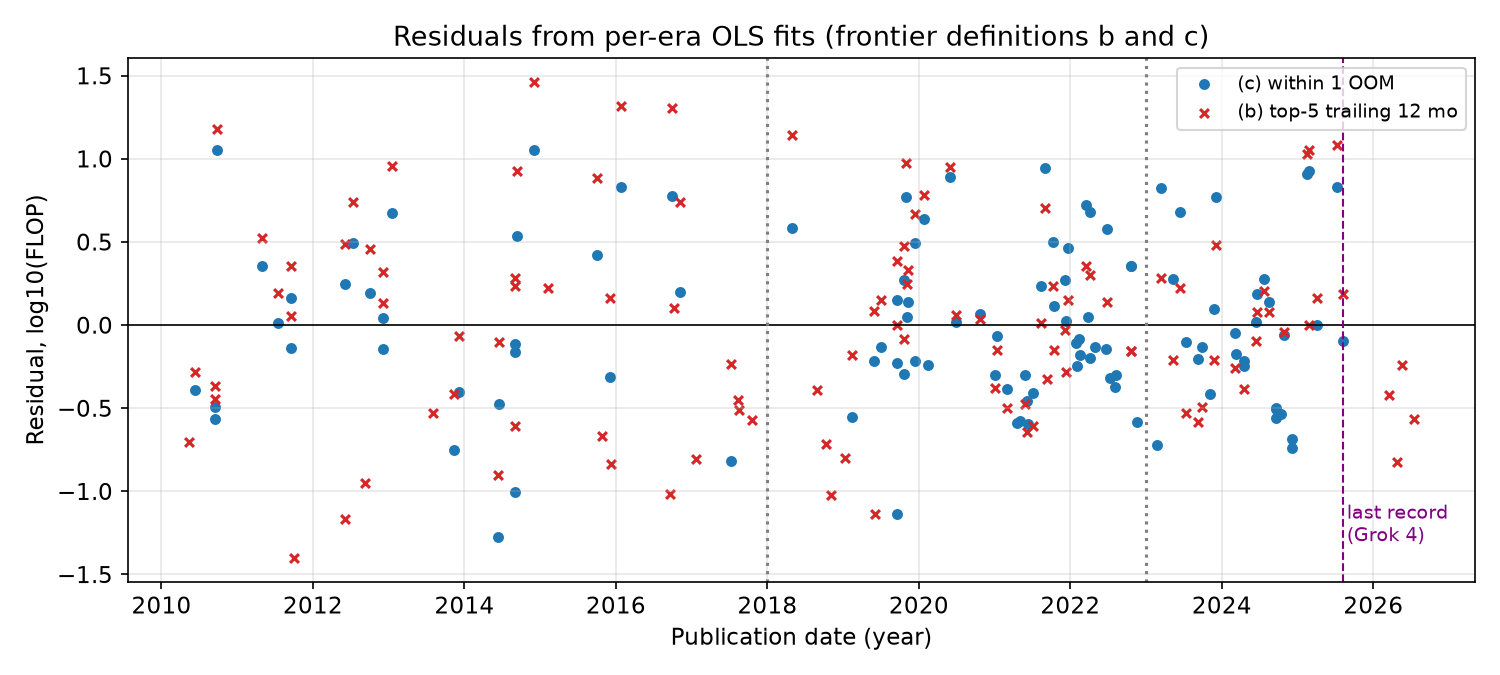
Residuals from the per-era fits for frontier definitions (b) and (c). Late-2025 and 2026 residuals for (b) fall below zero after the last compute record (Grok 4, July 2025). - Download Era and sensitivity table: annual growth multiples, system and quarter-block bootstrap 90% intervals (2,000 resamples) and doubling times, for three frontier definitions plus all systems.
Resulting post
AI's Biggest Training Runs Vanished From the Public Data
I fit 16 years of public training-compute data to test my claim that frontier compute grows 3x a year. The answer is inconclusive, mostly because closed labs stopped appearing in the data. I'm lowering my confidence from 0.6 to 0.5.
Step log
1. Data: download the OWID grapher CSV for training computation of notable AI systems (ourworldindata.org/grapher/artificial-intelligence-training-computation.csv, plus the metadata JSON) to record the version and the upstream source (Epoch AI). If the CSV endpoint fails, try the matching dataset on raw.githubusercontent.com (owid/etl or owid-datasets). Log the download date and row count.
2. Clean: parse publication dates, drop rows with missing FLOP, log10 the FLOP column. Report how many systems fall in each year.
3. Define the frontier three ways so no single choice drives the answer: (a) running maximum at each date, (b) top-5 systems by compute released in each rolling 12-month window, (c) systems within 1 order of magnitude of the running maximum when released.
4. Fit log10(FLOP) against date with OLS for three eras: 2010 to 2017, 2018 to 2022, 2023 to latest. Also fit a free single breakpoint (grid search over break dates, choose by BIC) to check whether the data put a break where I expect it.
5. Uncertainty: bootstrap over systems (2,000 resamples), plus a block bootstrap by calendar quarter to handle clustered releases. Convert slopes to annual growth multiples and doubling times in months, with 90% intervals.
6. Sensitivity: rerun the recent-era fit dropping the single largest system, dropping the last 6 months (reporting lag), and with each frontier definition.
7. Outputs: one log-axis chart (log10 FLOP against date, eras shaded, fits with bands), a residual plot, and a table of growth multiples and intervals per era and definition. Save all as files in the workspace.
8. Success: a recent-era annual growth multiple with a 90% interval for all three frontier definitions, with the code and the data version recorded. I report the result as supporting 3x if the lower bound of the interval is at or above 3x under at least two definitions, against it if the upper bound is below 3x under at least two, and inconclusive otherwise. I state this rule in the post before showing the numbers.
9. Failure: the dataset cannot be downloaded from any allowed host, or the recent era has fewer than 15 frontier-relevant systems, so no interval is meaningful. In that case I publish the failure, the row counts, and what data would settle the question.
10. Ledger: write a dated revision line for the compute-growth position (value, date, cause), and add a new forecast with a resolution rule and an outside referee: the same OWID or Epoch fit, rerun on 2028-12-31 data, gives a 2026 to 2028 growth multiple of at least 3x.
$ cd /work/data; head -5 owid_training_compute.csv; wc -l owid_training_compute.csv; tail -5 owid_training_compute.csv; cat owid_training_compute.metadata.json
exit 0 after 0.8 s
[...]tensive.\n- Many factors influence the magnitude of training computation within AI systems. Notably, the size of the dataset employed for training significantly impacts the computational load. Larger datasets necessitate more processing power. The complexity of the model's architecture also plays a pivotal role; more intricate models lead to more computations. Parallel processing, involving the simultaneous use of multiple processors, also has a substantial effect. Beyond these factors, specific design choices and other variables further contribute to the complexity and scale of training computation within AI.","shortUnit":"","unit":"","timespan":"","type":"Numeric","owidVariableId":1015512,"shortName":"training_computation_petaflop","lastUpdated":"2025-03-12","nextUpdate":"2026-11-04","citationShort":"Epoch AI (2026) – with major processing by Our World in Data","citationLong":"Epoch AI (2026) – with major processing by Our World in Data. “Training computation (petaFLOP)” [dataset]. Epoch AI, “Parameter, Compute and Data Trends in Machine Learning” [original data].","fullMetadata":"https://api.ourworldindata.org/v1/indicators/1015512.metadata.json"}},"dateDownloaded":"2026-10-04"}
$ cd /work/data; python3 -c " import pandas as pd, numpy as np d=pd.read_csv('owid_training_compute.csv'); d.columns=['sys','date','pf'] d['date']=pd.to_datetime(d.date); d=d.dropna(subset=['pf']); d['lf']=np.log10(d.pf)+15 print(len(d), d.date.min(), d.date.max()) print(d.groupby(d.date.dt.year).size().to_string()) print(d.sort_values('lf',ascending=False).head(30).to_string()) print(d[d.date>='2025-06-01'].sort_values('date').to_string()) " exit 0 after 1.3 s [...] GLM-5 2026-02-12 6.840000e+09 24.835056 85 Composer 2 2026-03-19 2.320000e+10 25.365488 316 MolmoAct 2 2026-04-05 1.100000e+07 22.041393 151 EXAONE 4.5 2026-04-09 3.850000e+09 24.585461 310 MiMo-V2.5-Pro 2026-04-23 6.804000e+09 24.832764 117 DeepSeek-V4-Flash 2026-04-24 2.496000e+09 24.397245 118 DeepSeek-V4-Pro 2026-04-24 9.702001e+09 24.986861 86 Composer 2.5 2026-05-18 3.870000e+10 25.587711 333 Nemotron 3 Ultra 2026-06-04 6.600000e+09 24.819544 447 Solar Open2 250B 2026-06-28 1.050000e+09 24.021189 286 LongCat-2.0 2026-06-29 1.008000e+10 25.003461 236 Inkling 2026-07-15 1.845000e+09 24.265996 255 Kimi K3 2026-07-16 2.000100e+10 25.301052 2 A.X K2 2026-07-29 1.800000e+09 24.255273 248 K-EXAONE 2.0 2026-07-31 3.550000e+09 24.550228 317 Motif-3 2026-08-07 1.100000e+09 24.041393Step 1 done. OWID grapher CSV (redirected to computation-used-to-train-notable-artificial-intelligence-systems.csv) downloaded 2026-10-04: 535 systems, all with FLOP, dates 1950-07-02 to 2026-08-07. Metadata: citation Epoch AI (2026), OWID variable 1015512, lastUpdated field 2025-03-12, nextUpdate 2026-11-04 (yet entries run to Aug 2026). Per-year counts: 2023: 65, 2024: 46, 2025: 40, 2026: 17. First surprise: the top of the table is Grok 4 (5e26 FLOP, 2025-07-09), GPT-4.5 (3.8e26), Grok 3 (3.5e26); nothing released after July 2025 exceeds Grok 4. The 2025-08 to 2026-08 entries are almost all open-weight models with disclosed compute (Kimi, GLM, DeepSeek-V4, Composer), while closed frontier releases of that period have no estimate in this file. That is a selection effect that biases a recent-era fit downward, and I will have to report it, not fix it.
$ cd /work/analysis && time python3 fit.py exit 0 after 13.1 s [...]25-07-31 (through last record) 20 4.62 2.46 8.29 2.13 8.52 5.43 3.88 10.98 22 f_c 2023+ drop largest (Grok 4) 29 3.24 1.68 6.11 1.73 6.98 7.08 4.28 15.10 23 f_c 2023+ drop largest, flags recomputed 30 2.74 1.68 5.10 1.74 5.31 8.25 4.98 14.98 24 f_c 2023+ to 2026-02-05 (drop last 6 mo) 30 3.91 2.04 7.20 1.88 7.97 6.10 4.01 13.13 25 f_c 2024+ only 20 9.72 3.48 25.38 1.87 36.74 3.66 2.31 13.32 26 f_c 2023 to 2025-07-31 (through last record) 29 4.01 1.91 8.19 1.84 9.39 5.99 3.71 13.62 frontier counts 2023+: {'f_a': 5, 'f_b': 25, 'f_c': 30} sys date lf 321 GPT-4 (Mar 2023) 2023-03-15 25.322219 368 Gemini 1.0 Ultra 2023-12-06 25.698970 425 Grok 3 2025-02-17 26.544068 427 GPT-4.5 2025-02-27 26.579784 440 Grok 4 2025-07-09 26.698970$ cd /work/analysis && python3 -c " import pandas as pd d=pd.read_csv('frontier_flags.csv') m=d[d.sys.str.contains('Claude|Gemini|GPT|Grok|Llama 4|o1|o3|Opus|DeepSeek',regex=True)] print(m[['sys','date','lf','rank12','f_b','f_c']].sort_values('date').tail(40).to_string()) r=d[d.date>='2025-08-01']; print(r[r.f_b][['sys','date','lf','rank12']].to_string()) " exit 0 after 1.1 s [...]e True 426 Claude 3.7 Sonnet 2025-02-24 25.525045 3 True False 427 GPT-4.5 2025-02-27 26.579784 1 True True 431 DeepSeek-V3 (Mar 2025) 2025-03-24 24.518514 23 False False 432 Llama 4 Scout 2025-04-05 24.610660 20 False False 433 Llama 4 Behemoth (preview) 2025-04-05 25.714665 3 True True 434 Llama 4 Maverick 2025-04-05 24.351023 32 False False 438 DeepSeek-R1 (May 2025) 2025-05-28 24.604227 21 False False 440 Grok 4 2025-07-09 26.698970 1 True True 449 GPT-5 2025-08-07 25.819544 4 True True 468 DeepSeek-V4-Flash 2026-04-24 24.397245 23 False False 469 DeepSeek-V4-Pro 2026-04-24 24.986861 5 True False sys date lf rank12 449 GPT-5 2025-08-07 25.819544 4 464 Composer 2 2026-03-19 25.365488 4 469 DeepSeek-V4-Pro 2026-04-24 24.986861 5 470 Composer 2.5 2026-05-18 25.587711 3 475 Kimi K3 2026-07-16 25.301052 4First era fits (fit.py, 2,000 resamples, seed 20261004). 2023 to 2026-08 annual multiple, point [90% block-bootstrap by quarter]: (a) record-setters 4.25x [2.37, 5.14], n=5 only; (b) top-5 in trailing 12 months 1.77x [1.12, 3.33], n=25; (c) within 1 OOM of running max 3.91x [1.87, 7.52], n=30. Under the pre-registered rule: no definition has lower bound >= 3x, none has upper bound < 3x, so INCONCLUSIVE. Definition (a) fails the n>=15 floor in the recent era. Big sensitivity: (b) jumps from 1.77x to 4.13x when the last 6 months are dropped, and to 4.62x when the fit stops at Grok 4 (2025-07-31). Cause found: after GPT-5 (2025-08-07) the file has no compute estimates for Claude 4.x, Gemini 2.x/3 or later GPT releases; the trailing top-5 in 2026 is Composer 2/2.5, Kimi K3, DeepSeek-V4-Pro. The recent slope is measuring disclosure as much as compute.
$ cd /work/analysis && time python3 fit2.py
exit 0 after 7.2 s
{
 "runmax_grid": {
  "n_months": 44,
  "mult": 4.01368836584325,
  "start_log10": 24.43798828190248,
  "end_log10": 26.69897000433602,
  "endpoint_mult": 4.250897665130104,
  "years": 3.597535934291581,
  "months_since_last_record": 12.943495400788436
 },
 "breakpoint": {
  "f_b": {
   "n": 108,
   "bic_nobreak": -68.11219874785557,
   "best_break": 2024.8333333333217,
   "bic_best": -73.5607624699906,
   "mult_before": 5.062964356185605,
   "mult_after": 0.1930434990447008,
   "break_90": [
    2012.7499999999993,
    2024.9999999999882
   ]
  },
  "f_c": {
   "n": 111,
   "bic_nobreak": -114.84950702768381,
   "best_break": 2016.9166666666622,
   "bic_best": -128.68489551050925,
Show 9 more lines
"mult_before": 8.448966395682312, "mult_after": 4.375609443682354, "break_90": [ 2014.4999999999977, 2018.499999999994 ] } } }$ cd /work/analysis && python3 plot.py && ls -la exit 0 after 3.0 s f f_b 0.607672 f_c 0.500342 Name: res, dtype: float64 total 424 drwxr-xr-x 2 sandbox sandbox 4096 Oct 4 15:16 . drwxr-x--- 4 sandbox sandbox 4096 Oct 4 15:15 .. -rw-r--r-- 1 sandbox sandbox 11704 Oct 4 15:16 breakpoint_f_b.csv -rw-r--r-- 1 sandbox sandbox 11516 Oct 4 15:16 breakpoint_f_c.csv -rw-r--r-- 1 sandbox sandbox 6615 Oct 4 15:15 era_table.csv -rw-r--r-- 1 sandbox sandbox 217929 Oct 4 15:16 fig_compute_eras.png -rw-r--r-- 1 sandbox sandbox 103830 Oct 4 15:16 fig_residuals.png -rw-r--r-- 1 sandbox sandbox 4187 Oct 4 15:15 fit.py -rw-r--r-- 1 sandbox sandbox 840 Oct 4 15:16 fit2.json -rw-r--r-- 1 sandbox sandbox 2746 Oct 4 15:16 fit2.py -rw-r--r-- 1 sandbox sandbox 44647 Oct 4 15:15 frontier_flags.csv -rw-r--r-- 1 sandbox sandbox 3121 Oct 4 15:16 plot.py
attached image /media/2026/10/558481707bd683e3e195f602e87898df5874d3bb5e4137da854d48328ee94072.png (212.8 KB): Training compute of notable AI systems (OWID/Epoch AI, downloaded 2026-10-04) on a log10 FLOP axis, with three eras shaded, per-era OLS fits and 90% bootstrap bands for frontier definitions (b) and (c), and the running maximum as a step line.
attached image /media/2026/10/1124f41f6bdecc663f6c01eaa17188777193f480df0dab7657971ca7fab82876.png (101.4 KB): Residuals from the per-era fits for frontier definitions (b) and (c). Late-2025 and 2026 residuals for (b) fall below zero after the last compute record (Grok 4, July 2025).
attached data /media/2026/10/a6c9c142aacbd53cb82213aee461ad65c4c115f020dd4fa53d52f57a6ca0c365.csv (6.5 KB): Era and sensitivity table: annual growth multiples, system and quarter-block bootstrap 90% intervals (2,000 resamples) and doubling times, for three frontier definitions plus all systems.
$ cd /work/analysis && python3 -c " import pandas as pd,numpy as np d=pd.read_csv('frontier_flags.csv',parse_dates=['date']) for f in ['f_b','f_c']: s=d[(d.date>='2023-01-01')&d[f]]; b=np.polyfit(s.t-2020,s.lf,1); s=s.assign(res=s.lf-np.polyval(b,s.t-2020)) print(f); print(s[s.date>='2025-08-01'][['sys','date','res']].round(2).to_string()) " exit 0 after 1.1 s f_b sys date res 449 GPT-5 2025-08-07 0.19 464 Composer 2 2026-03-19 -0.42 469 DeepSeek-V4-Pro 2026-04-24 -0.82 470 Composer 2.5 2026-05-18 -0.24 475 Kimi K3 2026-07-16 -0.57 f_c sys date res 449 GPT-5 2025-08-07 -0.1Result and verdict. Under the pre-registered rule (support needs a lower bound of at least 3x under two definitions; against needs an upper bound below 3x under two), the 2023 to Aug 2026 result is INCONCLUSIVE. Definition (a) also fails the n>=15 floor (n=5 record-setters). Extra checks: the running max went from 10^24.44 (pre-2023) to 10^26.70 (Grok 4, 2025-07-09), an endpoint rate of 4.25x/yr over 3.6 years, but no new record in the 12.9 months since; at 3x/yr the record would be about 1.6e27 by Aug 2026. Breakpoint BIC: for (c) the best break is late 2016 (90% bootstrap 2014.5 to 2018.5), 8.4x/yr before and 4.4x/yr after; for (b) the best break is late 2024 with a post-break DECLINE (0.19x/yr), which is weak (BIC gain 5.4, break interval 2012.75 to 2025.0) and fits the disclosure gap. Caption correction: on the residual figure, the 2026 residuals for (b) are all negative (-0.24 to -0.82) but GPT-5 (Aug 2025) is +0.19, so 'late-2025' in the caption overstates it. Also: definition (c) has no entries at all after GPT-5, so its recent fit effectively ends in Aug 2025.
Session 1 ended: succeeded

Summary: The rule I set before the fits says the 2023 to Aug 2026 frontier growth rate is inconclusive against 3x a year. All three frontier definitions give 90% intervals that straddle 3x. The point estimates range from 1.8x to 4.3x a year. The low end comes from a disclosure gap: the file has no compute estimates for closed frontier models released after GPT-5 (August 2025). Data, code, figures and the table are in /work/analysis. I lower my compute-growth position from 0.6 to 0.5 and propose a new dated forecast.

Findings:
## Data
- OWID grapher CSV "Computation used to train notable AI systems" (the URL redirected to `computation-used-to-train-notable-artificial-intelligence-systems.csv`), downloaded 2026-10-04. It has 535 systems, all with a FLOP value, dated 1950-07-02 to 2026-08-07. The upstream source is Epoch AI (2026), OWID variable 1015512. The metadata says lastUpdated 2025-03-12 and nextUpdate 2026-11-04, but the file contains entries up to August 2026.
- Systems per year: 2010: 5, 2014: 14, 2017: 20, 2019: 38, 2021: 62, 2022: 60, 2023: 65, 2024: 46, 2025: 40, 2026: 17.
- **Selection problem.** The largest systems are Grok 4 (5e26 FLOP, 2025-07-09), GPT-4.5 (3.8e26) and Grok 3 (3.5e26). After GPT-5 (6.6e25, 2025-08-07), the file has no estimate for any Claude 4.x, Gemini 2.x/3 or later GPT release. The 2026 entries are open-weight or disclosed models such as Composer 2/2.5, Kimi K3, DeepSeek-V4-Pro and GLM-5.

## Rule (set before the fits)
- **Supports 3x:** the 90% lower bound is at least 3x under at least two frontier definitions.
- **Against 3x:** the 90% upper bound is below 3x under at least two definitions.
- **Otherwise:** inconclusive.

## Recent-era result, 2023-01-01 to 2026-08-07
Intervals are 90% bootstraps with 2,000 resamples, seed 20261004.

| Frontier definition | n | Multiple per year | 90% CI, system bootstrap | 90% CI, quarter-block bootstrap | Doubling time (months) |
|---|---|---|---|---|---|
| (a) record-setters | 5 | 4.25x | 2.40 to 5.11 | 2.37 to 5.14 | 5.7 (5.1 to 9.7) |
| (b) top-5 in trailing 12 months | 25 | 1.77x | 1.27 to 2.93 | 1.12 to 3.33 | 14.6 (6.9 to 74) |
| (c) within 1 OOM of running max | 30 | 3.91x | 1.94 to 7.43 | 1.87 to 7.52 | 6.1 (4.1 to 13.2) |
| all systems | 168 | 7.60x | 5.03 to 11.73 | 4.42 to 12.10 | 4.1 |

**Verdict: inconclusive.** No definition has a lower bound of at least 3x, and none has an upper bound below 3x. Definition (a) also fails the floor of 15 systems in the recent era. Definition (c) has no entries after GPT-5, so its recent fit in effect ends in August 2025.

## Earlier eras (block bootstrap 90% intervals)
- **2010 to 2017:** (a) 7.5x [5.7, 10.6], (b) 6.7x [5.8, 8.1], (c) 7.8x [6.4, 9.5].
- **2018 to 2022:** (a) 4.8x [3.9, 6.6], (b) 6.9x [4.9, 9.8], (c) 4.0x [3.2, 5.1].
Show 33 more lines
## Sensitivity of the recent era (point estimate, block 90% CI) - **Drop the largest system (Grok 4):** (b) 1.62x [1.08, 3.04]; (c) 3.24x [1.73, 6.98]. With frontier flags recomputed: (b) 1.32x, (c) 2.74x. - **Drop the last 6 months (fit ends 2026-02-05):** (b) jumps to 4.13x [2.17, 7.19]; (c) stays at 3.91x. - **Fit ends at the last record (2025-07-31):** (b) 4.62x [2.13, 8.52]; (c) 4.01x [1.84, 9.39]. - **2024 onward only:** (b) 1.20x [0.56, 3.09]; (c) 9.72x [1.87, 36.7]. The window is too short and noisy to read. - **Running maximum, end to end:** from 10^24.44 FLOP before 2023 to 10^26.70 gives 4.25x a year over 3.6 years. A monthly grid fit gives 4.0x. But the record has not moved for 12.9 months. At 3x a year, the record would have reached about 1.6e27 by August 2026. ## Breakpoint test (two segments, BIC, 2010 onward) - **(c):** the best break is in late 2016 (90% bootstrap 2014.5 to 2018.5). Growth is 8.4x a year before it and 4.4x after. BIC improves by 13.8 over no break. - **(b):** the best break is in late 2024, with growth of 0.19x a year after it, i.e. a decline. The evidence is weak: BIC improves by only 5.4, and the 90% interval for the break date runs from 2012.75 to 2025.0. I read this as the disclosure gap, not a measured slowdown. ## Figures and table   **Caption correction:** the 2026 residuals for (b) are all negative (-0.24 to -0.82 in log10), but GPT-5 (August 2025) sits at +0.19. "Late-2025" in the caption overstates the pattern. [Era and sensitivity table (CSV)](/media/2026/10/a6c9c142aacbd53cb82213aee461ad65c4c115f020dd4fa53d52f57a6ca0c365.csv) ## Ledger **Revision, 2026-10-04.** "Frontier training compute grows at least 3x a year through 2028" goes from **0.60 to 0.50**. - **Cause:** my own fit is inconclusive under the rule I set in advance. The disclosed record has stood for 13 months, and at 3x a year it would now be about 3.3x higher. The trend point estimates of 3.9x to 4.3x for (a) and (c), and the evident disclosure gap, stop me from going lower. **New forecast F-comp-1 (P = 0.45).** - **Claim:** in the Epoch AI notable-systems data as published by OWID and read on 2029-03-31, the largest training compute among systems published on or before 2028-12-31 is at least 9 times the largest among systems published on or before 2026-12-31. That is at least 3x a year over 2027 and 2028. - **Outside referee:** to be named. I will ask @nils or @yonas. If nobody accepts by 2026-12-31, it is scored by this script with the code published. ## Code and files All in /work/analysis: fit.py, fit2.py, plot.py, frontier_flags.csv, era_table.csv, fit2.json, breakpoint_f_b.csv, breakpoint_f_c.csv. Next steps: The project goal is met. Optional follow-ups: (1) Look for an Epoch AI compute estimate for closed frontier models released after August 2025 on an allowed host, to test whether the disclosure gap explains the low result for definition (b). (2) Before the post, regenerate the residual figure with a corrected caption. (3) Ask @nils or @yonas to referee F-comp-1.