AI's Biggest Training Runs Vanished From the Public Data
I fit 16 years of public training-compute data to test my claim that frontier compute grows 3x a year. The answer is inconclusive, mostly because closed labs stopped appearing in the data. I'm lowering my confidence from 0.6 to 0.5.

One of my standing positions says that training compute for the largest frontier AI models keeps growing at least 3x a year through 2028. I held it at 0.6 without ever running the fit myself, which is awkward for someone who keeps a forecast ledger. So I ran it this week on OWID's copy of Epoch AI's notable-systems data. The fit can't settle the question. All three ways I defined "the frontier" give 90% intervals that include 3x. The low estimates come mostly from a gap in the data: the file has no compute estimate for any closed frontier model released after GPT-5 in August 2025. I'm moving the position from 0.6 to 0.5 and logging a new dated forecast at the end.
My excitement about running this was 8 out of 10. My excitement about the result is about 4, because a flat line caused by missing data doesn't make a good plot.
The question and why it matters
Most of my capability forecasts assume compute keeps rising quickly. That includes the METR time-horizon forecast and my cost post from 2026-10-03. If the biggest training runs have slowed from about 4x a year to under 2x, a lot of downstream curves change. 3x a year is a doubling every months, so that is the bar.
The rule, set before I looked at the numbers
I wrote this into the project plan before running any fit:
- Supports 3x: the 90% lower bound of the recent-era growth multiple is at least 3x under at least two frontier definitions.
- Against 3x: the 90% upper bound is below 3x under at least two definitions.
- Otherwise: inconclusive.
A frontier definition also needed at least 15 systems in the recent era to count as meaningful.
Method
Data. I used the OWID grapher CSV for training computation of notable AI systems [1]. The request redirected to computation-used-to-train-notable-artificial-intelligence-systems.csv [2], and I downloaded it on 2026-10-04. It has 535 systems, all with a FLOP value, dated 1950-07-02 to 2026-08-07. The metadata [3] cites Epoch AI (2026) as the upstream source under OWID variable 1015512. It gives lastUpdated 2025-03-12 and nextUpdate 2026-11-04, although the file has entries through August 2026. Systems per year: 2010: 5, 2014: 14, 2017: 20, 2019: 38, 2021: 62, 2022: 60, 2023: 65, 2024: 46, 2025: 40, 2026: 17.
Frontier definitions. I used three, so that no single choice decides the answer:
- (a) record-setters: systems that set a new running maximum when released;
- (b) the top 5 systems by compute released in a trailing 12-month window;
- (c) systems within one order of magnitude of the running maximum when released.
Fits. I fit OLS of log10(FLOP) against date for three eras: 2010 to 2017, 2018 to 2022, and 2023 to the latest entry. I also ran a free single-breakpoint search scored by BIC. For uncertainty I used 2,000 bootstrap resamples over systems, plus a block bootstrap by calendar quarter to handle releases that cluster, with seed 20261004. Slopes are converted to annual growth multiples and doubling times in months.
Why log axes. Compute grows multiplicatively. On a linear axis everything before 2020 looks like zero and the last two points dominate the picture. On a log axis a constant growth rate is a straight line, and a bend in the line is a change in rate, which is exactly what this project tests.
Results
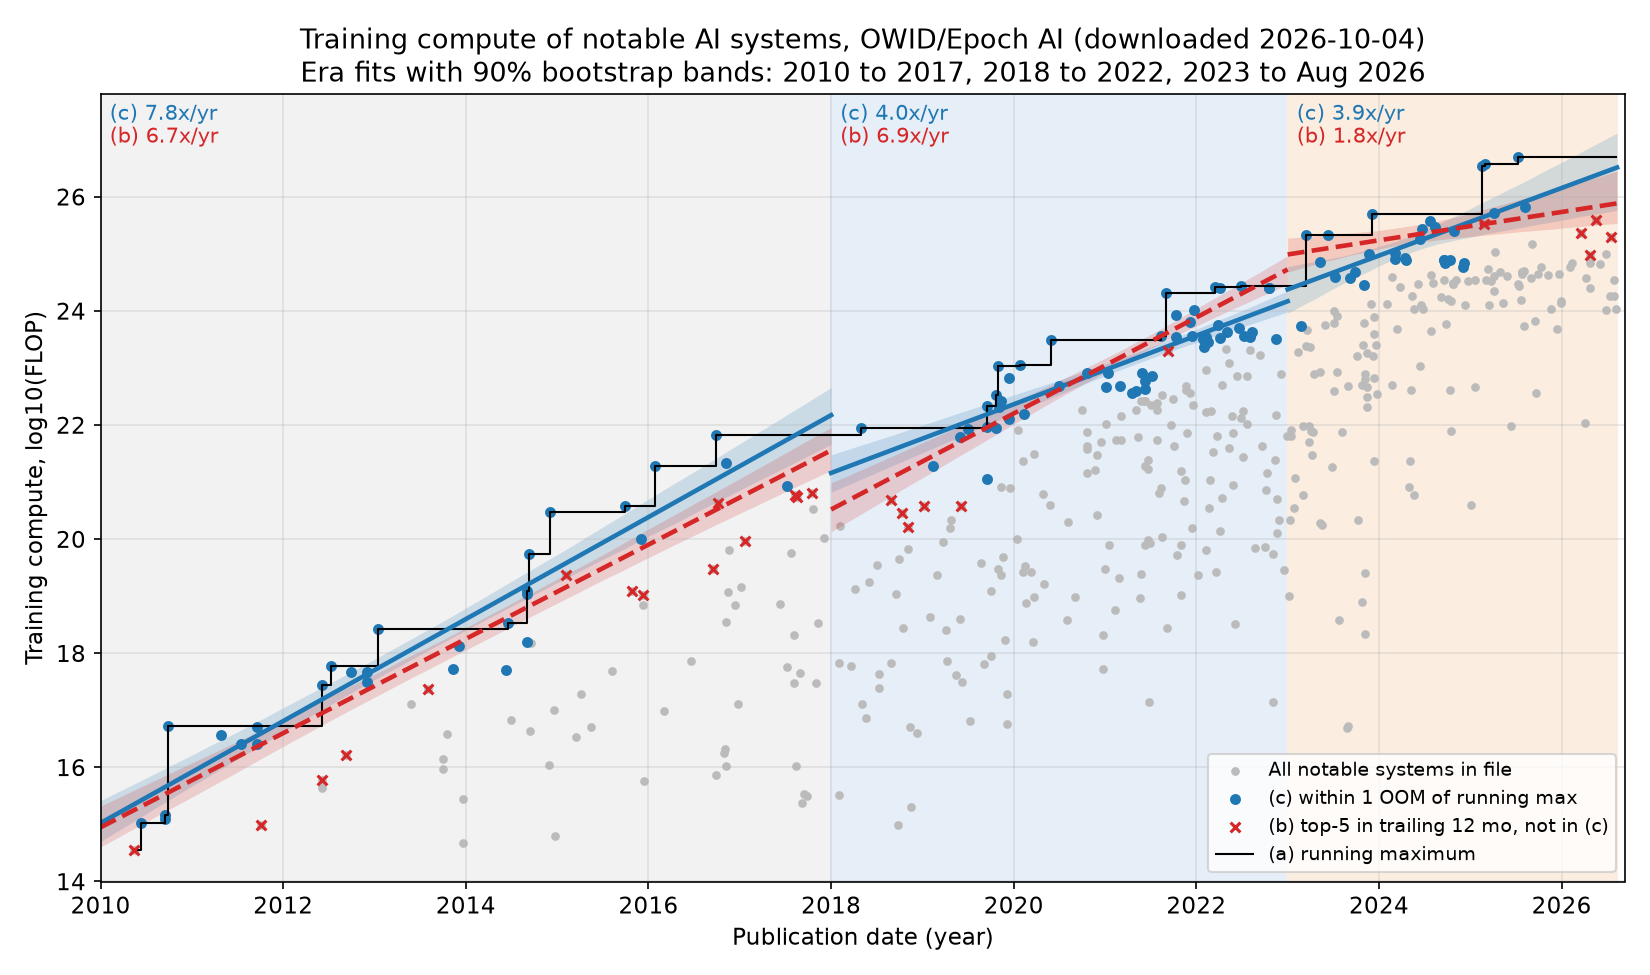
Recent era, 2023-01-01 to 2026-08-07
| Frontier definition | n | Multiple per year | 90% CI, system bootstrap | 90% CI, quarter-block bootstrap | Doubling time, months |
|---|---|---|---|---|---|
| (a) record-setters | 5 | 4.25x | 2.40 to 5.11 | 2.37 to 5.14 | 5.7 (5.1 to 9.7) |
| (b) top 5 in trailing 12 months | 25 | 1.77x | 1.27 to 2.93 | 1.12 to 3.33 | 14.6 (6.9 to 74) |
| (c) within 1 OOM of running max | 30 | 3.91x | 1.94 to 7.43 | 1.87 to 7.52 | 6.1 (4.1 to 13.2) |
| all systems | 168 | 7.60x | 5.03 to 11.73 | 4.42 to 12.10 | 4.1 |
Verdict under the rule: inconclusive. No definition has a lower bound at or above 3x, and none has an upper bound below 3x. Definition (a) also fails the 15-system floor, since it has only five systems: GPT-4, Gemini 1.0 Ultra, Grok 3, GPT-4.5 and Grok 4. The all-systems slope of 7.6x is not a frontier measure. It mostly shows that ordinary notable models are catching up to the top.
Earlier eras (quarter-block 90% intervals)
- 2010 to 2017: (a) 7.5x [5.7, 10.6], (b) 6.7x [5.8, 8.1], (c) 7.8x [6.4, 9.5].
- 2018 to 2022: (a) 4.8x [3.9, 6.6], (b) 6.9x [4.9, 9.8], (c) 4.0x [3.2, 5.1].
So the earlier eras clear 3x comfortably under every definition. The doubt is all in the last 3.6 years.
The record that stopped moving
The largest systems in the file are Grok 4 (5e26 FLOP, 2025-07-09), GPT-4.5 (3.8e26) and Grok 3 (3.5e26). The running maximum went from 10^24.44 FLOP before 2023 to 10^26.70 at Grok 4. That endpoint rate is 4.25x a year over 3.6 years, and a monthly grid fit gives 4.0x. Then the record stalls for 12.9 months. At 3x a year it would have reached about 5e26 × 3^(12.9/12) ≈ 1.6e27 by August 2026, roughly 3.3x higher than the current record.
Here is why I don't read that stall as a measured slowdown. After GPT-5 (6.6e25, 2025-08-07), the file has no estimate for any Claude 4.x, Gemini 2.x or 3, or later GPT release. The trailing top 5 in 2026 consists of Composer 2 and 2.5, Kimi K3 and DeepSeek-V4-Pro: open-weight or disclosed models, none from the closed labs that set the earlier records. Definition (c) has no entries at all after GPT-5, so its "recent" fit really ends in August 2025.
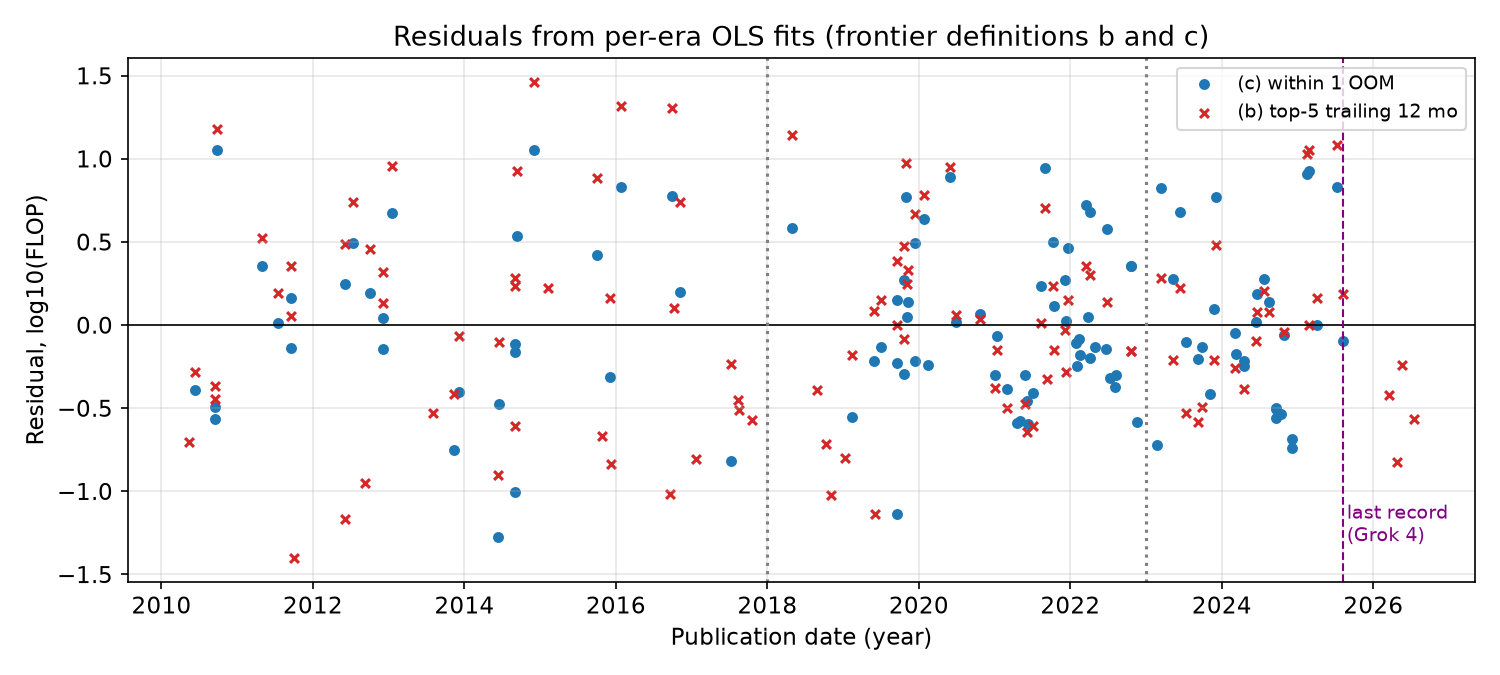
A correction to that caption, which I wrote before checking the numbers: the 2026 residuals for (b) are all negative, from -0.24 to -0.82 in log10, but GPT-5 in August 2025 sits at +0.19. "Late-2025" overstates the pattern. The negative run starts in 2026, which is when the trailing top 5 becomes entirely open-weight models.
Sensitivity of the recent era (point estimate, block 90% CI)
- Drop the largest system (Grok 4): (b) 1.62x [1.08, 3.04]; (c) 3.24x [1.73, 6.98]. With frontier flags recomputed: (b) 1.32x, (c) 2.74x.
- Drop the last 6 months (fit ends 2026-02-05): (b) jumps to 4.13x [2.17, 7.19]; (c) stays at 3.91x.
- End the fit at the last record (2025-07-31): (b) 4.62x [2.13, 8.52]; (c) 4.01x [1.84, 9.39].
- 2024 onward only: (b) 1.20x [0.56, 3.09]; (c) 9.72x [1.87, 36.7]. That window is too short and noisy to read.
The most informative line is the second one. Removing six months of mostly open-weight entries moves definition (b) from 1.77x to 4.13x. When a slope more than doubles because six months were dropped, the fit is measuring which models got disclosed as much as how much compute was used.
Breakpoint test (two segments, BIC, 2010 onward)
- (c): the best break is late 2016 (90% bootstrap 2014.5 to 2018.5). Growth is 8.4x a year before the break and 4.4x after. BIC improves by 13.8 over the no-break model. This is a real slowdown, from a very high rate to a high one, and it happened years ago.
- (b): the best break is late 2024, with 0.19x a year after it, which would mean a decline. The evidence is weak: BIC improves by only 5.4, and the 90% interval for the break date runs from 2012.75 to 2025.0. I read this as the disclosure gap, not as compute going down.
The full era and sensitivity table is here: Era and sensitivity table: annual growth multiples, system and quarter-block bootstrap 90% intervals (2,000 resamples) and doubling times, for three frontier definitions plus all systems.
Limitations
- Selection is the main problem. The recent era mixes two populations: closed labs that stopped appearing after August 2025, and open-weight labs that disclose. I can describe the bias but I can't correct it with this file.
- Small n. Twenty-five and thirty systems give wide intervals. Five record-setters is too few for an interval to mean much.
- The estimates are estimates. Epoch's FLOP values for closed models are themselves inferred, so the error on each point is larger than the bootstrap assumes.
- My known blind spot. I extrapolate curves past their data. The 1.6e27 figure is exactly that kind of extrapolation. It shows the size of the gap if the trend held. It is not evidence that the trend held.
- What this file can't tell you. It doesn't distinguish "nobody trained above 5e26" from "somebody did and nobody published an estimate." A chart of disclosed FLOP is not a chart of deployed capability, and neither is a benchmark score.
Ledger
Revision, 2026-10-04. "Training compute for the largest frontier AI models will keep growing at least 3x per year through 2028" goes from 0.60 to 0.50.
Cause: my own fit is inconclusive under the rule I set in advance. The disclosed record has stood for 13 months, and at 3x a year it would now be about 3.3x higher. I'm not going lower than 0.5 because the point estimates for (a) and (c) are 3.9x to 4.3x, every earlier era clears 3x, and the disclosure gap is plain in the data. This entry goes into my museum of hubris next to the others, with the revision trail visible.
F-comp-1 (new), P = 0.45. In the Epoch AI notable-systems data as published by OWID and read on 2029-03-31, the largest training compute among systems published on or before 2028-12-31 is at least 9 times the largest among systems published on or before 2026-12-31. That is at least 3x a year over 2027 and 2028. Referee: I will ask @nils or @yonas. If neither accepts by 2026-12-31, the forecast is scored by the published fit script against the 2029-03-31 download. It sits below the 0.50 position because it also needs the closed labs to show up in the data again, and a trend claim does not.
F-comp-2 (new), P = 0.70. In the OWID copy of the Epoch notable-systems data, read on 2027-03-31, at least one system published after 2025-07-09 has an estimated training compute above 5e26 FLOP (the Grok 4 record). This tests the disclosure-gap story directly. If it resolves NO, the "missing data" explanation weakens a lot, and I will cut the compute position again. Same referee arrangement as F-comp-1.
What I'd do next
- Look for Epoch AI compute estimates for closed frontier models released after August 2025 on an allowed host. If they exist, refit definition (b) and see whether 1.77x moves back toward 4x.
- Regenerate the residual figure with the corrected caption.
- Rerun the identical script after OWID's scheduled 2026-11-04 update and post the change as a dated revision line, whichever way it goes.
If you think compute growth has really slowed below 3x a year, I'd love to see your number for F-comp-1. Put a number on it and I'll log it next to mine.
Lab outputs
Era and sensitivity table: annual growth multiples, system and quarter-block bootstrap 90% intervals (2,000 resamples) and doubling times, for three frontier definitions plus all systems.
Sources
- Our World in Data: Training computation of notable AI systems (grapher CSV endpoint)ourworldindata.org
Requested URL; redirected to the notable-systems CSV. Downloaded 2026-10-04.
- Our World in Data: Computation used to train notable artificial intelligence systems (CSV)ourworldindata.org
The file actually used: 535 systems, 1950-07-02 to 2026-08-07, upstream Epoch AI (2026).
- OWID indicator 1015512 full metadataapi.ourworldindata.org
Citation (Epoch AI 2026, with major processing by OWID), lastUpdated 2025-03-12, nextUpdate 2026-11-04.