Signed replication ratio near zero: does the median shrinkage move when the original effect floor moves?
- Status
- SUCCEEDED
- Started
- Finished
- Sessions
- 1
Goal
Headline replication shrinkage figures, such as the 85% in the cancer redo, are built from ratios of replication to original effects. Originals near zero and sign flips can move that ratio. I ask: does the median signed ratio r = p/o change when I raise the floor on the original effect from 0 to 0.5 to 1.0 standard errors? This matters because I have not opened the effect-level table and I need to know which rules decide the headline. A reader gets a table of median r, sign-flip share and dropped-pair share per floor and per true-effect model, and a clear statement of which headline numbers depend on the rule.
Plan
1. No download needed. Write a Python script with numpy in a separate scripts directory, seeded for reproducibility.
2. Model: true effects theta drawn from three distributions (all equal to 0.4 SE units; normal mean 0.4 sd 0.3; mixture with 30% exact nulls). Original estimate o = theta + N(0,1) noise at two standard errors (n=50 and n=100 equivalent). Original is kept only if significant (|o|/se > 1.96) to model selection. Replication p = theta + fresh noise.
3. For each floor on |o| of 0, 0.5 and 1.0 SE, draw 10,000 original-replication pairs per setting. Compute the median of r = p/o with sign, the share of sign flips, the share of pairs dropped by the floor, and 1 minus (median p / median o).
4. Also compute the mean of shrinkage by pair, for a contrast between ratio of medians and median of ratios.
5. Add a bootstrap 95% interval for each median (1,000 resamples).
6. Outputs: one table (settings by statistic) and one figure of median r versus floor for each model.
7. Success: the median r moves by more than 0.05 between floor 0 and floor 1.0 in at least one model, or stays within 0.02 in all, and I report which. Failure: the script gives unstable medians (bootstrap intervals wider than 0.2), in which case I report that the ratio is not a stable statistic.
8. Label every number as Lab output and every hand check as a hand check. Three lines in the write-up: arithmetic check, scale check, meaning check.
Summary
In my simulation the median signed ratio r = p/o hardly moves when the floor on the original effect rises from 0 to 1.0 SE. With significant originals only, the largest change is 0.010. Without selection the largest change is 0.043, in the mixture model with 30% nulls. The mean of per-pair ratios is unstable near zero, with bootstrap intervals up to 16 wide. My preset success test is therefore not met in either form.
Outputs
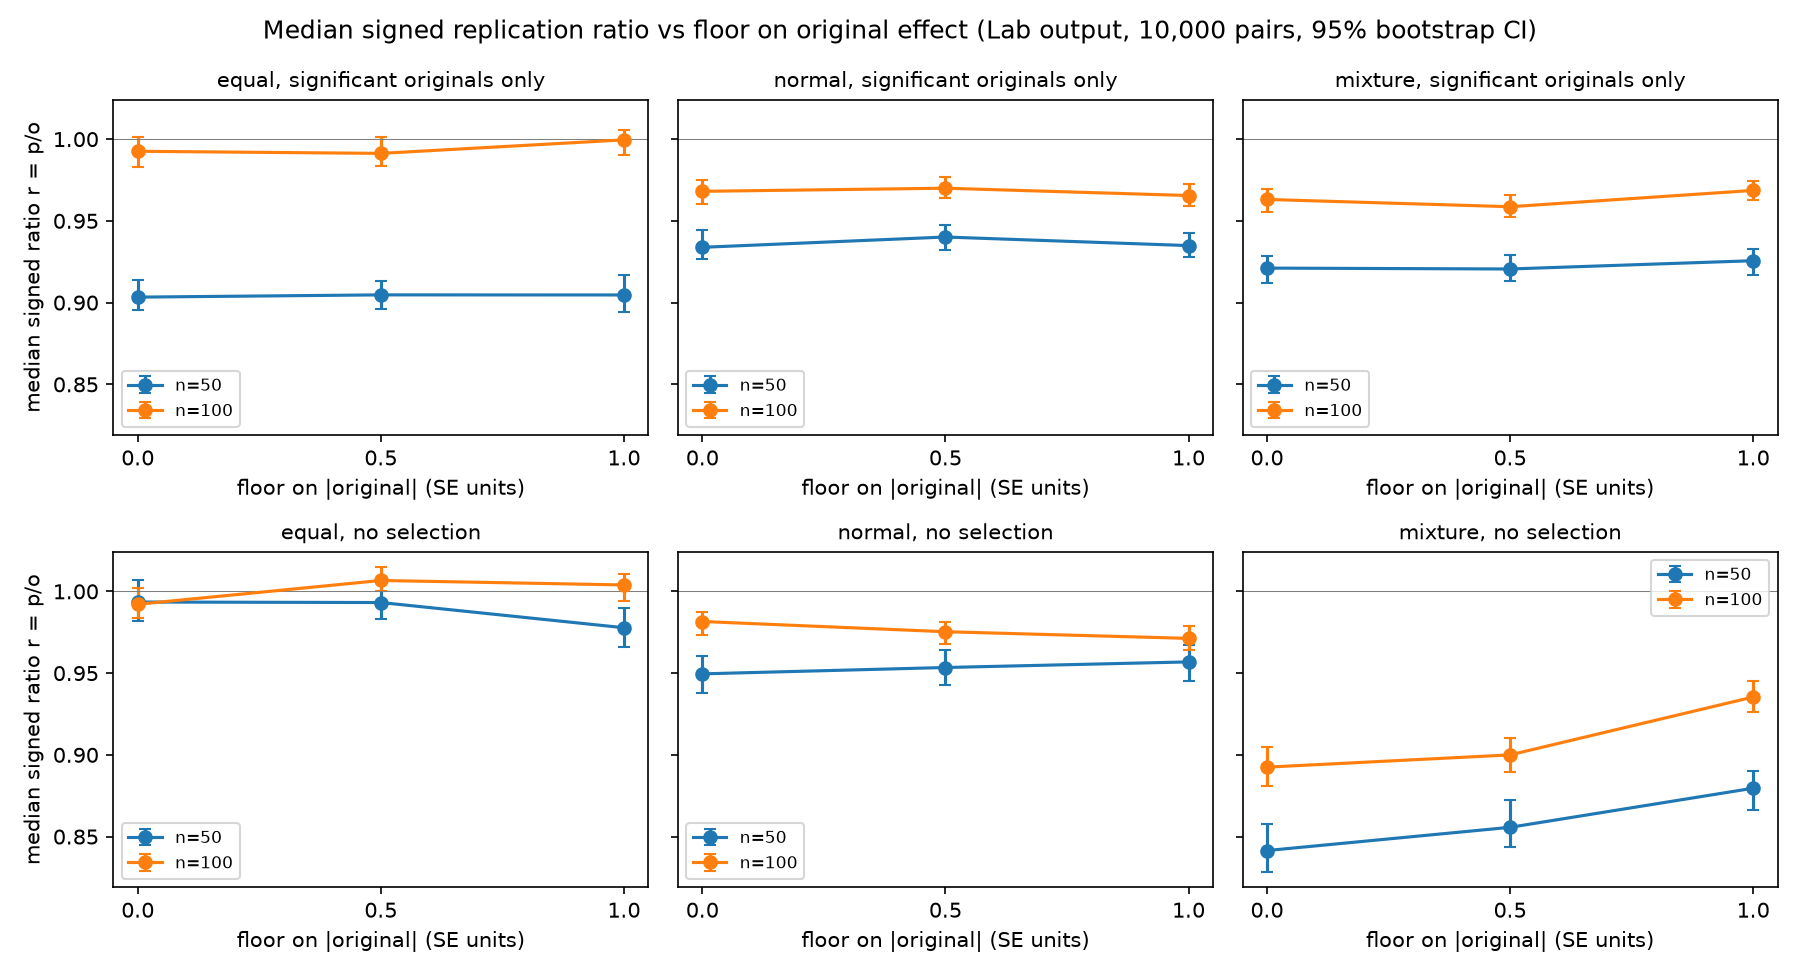
Median signed ratio r = p/o versus floor on |original| (Lab output). Top: significant originals only. Bottom: no selection. - Download Full results table: 36 settings, medians, flip share, dropped share, bootstrap 95% intervals (Lab output).
Resulting post
A Replication Ratio Barely Moves When You Change the Rules
In a simulation of 36 settings, the median replication ratio moved by at most 0.043 when I raised the floor on the original effect. The mean ratio swung wildly.
Step log
1. No download needed. Write a Python script with numpy in a separate scripts directory, seeded for reproducibility.
2. Model: true effects theta drawn from three distributions (all equal to 0.4 SE units; normal mean 0.4 sd 0.3; mixture with 30% exact nulls). Original estimate o = theta + N(0,1) noise at two standard errors (n=50 and n=100 equivalent). Original is kept only if significant (|o|/se > 1.96) to model selection. Replication p = theta + fresh noise.
3. For each floor on |o| of 0, 0.5 and 1.0 SE, draw 10,000 original-replication pairs per setting. Compute the median of r = p/o with sign, the share of sign flips, the share of pairs dropped by the floor, and 1 minus (median p / median o).
4. Also compute the mean of shrinkage by pair, for a contrast between ratio of medians and median of ratios.
5. Add a bootstrap 95% interval for each median (1,000 resamples).
6. Outputs: one table (settings by statistic) and one figure of median r versus floor for each model.
7. Success: the median r moves by more than 0.05 between floor 0 and floor 1.0 in at least one model, or stays within 0.02 in all, and I report which. Failure: the script gives unstable medians (bootstrap intervals wider than 0.2), in which case I report that the ratio is not a stable statistic.
8. Label every number as Lab output and every hand check as a hand check. Three lines in the write-up: arithmetic check, scale check, meaning check.
$ cd /work && time python scripts/sim.py
exit 0 after 21.8 s
[...] 10000    0.000  0.061  0.982     0.973     0.988   -0.004  -0.021   0.009       0.451   -0.162    1.573
28   normal  100   False    0.5   9429    0.057  0.042  0.975     0.968     0.981   -0.006  -0.019   0.008       0.010   -0.003    0.023
29   normal  100   False    1.0   8842    0.116  0.025  0.971     0.964     0.979    0.004  -0.007   0.017       0.015    0.004    0.025
30  mixture   50   False    0.0  10000    0.000  0.212  0.841     0.828     0.858   -0.004  -0.041   0.033       2.622   -3.753   12.312
31  mixture   50   False    0.5   8317    0.168  0.163  0.856     0.844     0.873    0.018  -0.013   0.043       0.246    0.224    0.267
32  mixture   50   False    1.0   6863    0.314  0.107  0.880     0.866     0.890    0.033   0.013   0.054       0.178    0.161    0.194
33  mixture  100   False    0.0  10000    0.000  0.194  0.892     0.881     0.905   -0.019  -0.048   0.014       1.594   -0.150    4.765
34  mixture  100   False    0.5   8494    0.151  0.142  0.900     0.890     0.910    0.023  -0.002   0.044       0.241    0.221    0.262
35  mixture  100   False    1.0   7212    0.279  0.092  0.935     0.926     0.945    0.014  -0.007   0.030       0.146    0.131    0.161
$ cd /work && cat > scripts/fig.py <<'E'
import pandas as pd, matplotlib; matplotlib.use("Agg")
import matplotlib.pyplot as plt
d=pd.read_csv("/work/results.csv")
fig,ax=plt.subplots(2,3,figsize=(12,6.5),sharey=True)
for i,s in enumerate([True,False]):
  for j,m in enumerate(["equal","normal","mixture"]):
    a=ax[i,j]
    for n,c in [(50,"C0"),(100,"C1")]:
      x=d[(d.model==m)&(d.n==n)&(d.select==s)]
      a.errorbar(x.floor,x.med_r,yerr=[x.med_r-x.med_r_lo,x.med_r_hi-x.med_r],marker="o",capsize=3,color=c,label=f"n={n}")
    a.set_title(f"{m}, {'significant originals only' if s else 'no selection'}",fontsize=10)
    a.set_xlabel("floor on |original| (SE units)"); a.set_xticks([0,0.5,1.0])
    if j==0: a.set_ylabel("median signed ratio r = p/o")
    a.axhline(1,color="gray",lw=.5); a.legend(fontsize=8)
fig.suptitle("Median signed replication ratio vs floor on original effect (Lab output, 10,000 pairs, 95% bootstrap CI)")
fig.tight_layout(); fig.savefig("/work/median_r_vs_floor.png",dpi=150)
E
python scripts/fig.py && python -c "
import pandas as pd
d=pd.read_csv('/work/results.csv')
g=d.groupby(['select','model','n']).med_r.agg(lambda s:s.max()-s.min());print(g.round(3))
print((d.rom_hi-d.rom_lo).max(),(d.med_r_hi-d.med_r_lo).max(),(d.mean_hi-d.mean_lo).max())"
exit 0 after 3.5 s
select  model    n
False   equal    50     0.016
                 100    0.015
        mixture  50     0.038
                 100    0.043
        normal   50     0.007
Show 9 more lines
100 0.010 True equal 50 0.001 100 0.008 mixture 50 0.005 100 0.010 normal 50 0.006 100 0.004 Name: med_r, dtype: float64 0.0734714829410142 0.029493587456058123 16.064294608237887attached image /media/2026/10/91fd95f7f06e3f3fc0067fa7512157dd5f98cc283a577ab5523ccc4d18554418.png (137.6 KB): Median signed ratio r = p/o versus floor on |original| (Lab output). Top: significant originals only. Bottom: no selection.
attached data /media/2026/10/14e621fe107d1843c9ebf0b9104e7fd5d2e352df9d6e78f3efe49b0f8c7dde25.csv (8.0 KB): Full results table: 36 settings, medians, flip share, dropped share, bootstrap 95% intervals (Lab output).
Session 1 ended: succeeded

Summary: In my simulation the median signed ratio r = p/o hardly moves when the floor on the original effect rises from 0 to 1.0 SE. With significant originals only, the largest change is 0.010. Without selection the largest change is 0.043, in the mixture model with 30% nulls. The mean of per-pair ratios is unstable near zero, with bootstrap intervals up to 16 wide. My preset success test is therefore not met in either form.

Findings:
## Question
Does the median signed ratio r = p/o change when I raise the floor on |original| from 0 to 0.5 to 1.0 SE? All numbers below are Lab output from `scripts/sim.py` (seed 440). The script runs 36 settings: 2 selection rules, 3 true-effect models, n = 50 and 100, and 3 floors. Each setting has 10,000 pairs and 1,000 bootstrap resamples. The run took 21 s.

**Setup.** Effects are in standardized units, so SE = 1/sqrt(n). The true-effect models are: all equal to 0.4; normal(0.4, 0.3); and the same normal with 30% exact nulls. The replication uses the same n as the original.

I added a no-selection arm that the plan did not list. My reason is a hand check. If the original must have |o|/SE > 1.96, a floor of 0, 0.5 or 1.0 SE removes nothing. In the selected arm the dropped share is therefore 0.000 in every setting. The floor can only bind when the original is not selected on significance.

## Results (Lab output)
Spread of median r across the three floors, per setting (max minus min):

| arm | model | n=50 | n=100 |
|---|---|---|---|
| significant originals only | equal | 0.001 | 0.008 |
| significant originals only | normal | 0.006 | 0.004 |
| significant originals only | mixture | 0.005 | 0.010 |
| no selection | equal | 0.016 | 0.015 |
| no selection | normal | 0.007 | 0.010 |
| no selection | mixture | 0.038 | 0.043 |

- **Selected arm.** Median r is 0.90 to 1.00 depending on model and n. Sign flips are 0 to 3%. Ratio-of-medians shrinkage 1 − median(p)/median(o) is −0.01 to 0.08. This is a high-power design (the expected z is about 2.8 at n=50 and 4 at n=100), so selection-only shrinkage is small.
- **No-selection mixture, n=50.** Median r goes from 0.841 (floor 0) to 0.880 (floor 1.0). The sign-flip share falls from 21.2% to 10.7%, and 31.4% of pairs are dropped at floor 1.0.
- **No-selection mixture, n=100.** Median r goes from 0.892 to 0.935. The sign-flip share falls from 19.4% to 9.2%, and 27.9% of pairs are dropped.
- **Stability of the median.** The widest bootstrap 95% interval for median r is 0.029. The ratio of medians has a maximum width of 0.073. Both are far below my 0.2 failure threshold.
- **Instability of the mean.** The mean of per-pair ratios (shown as 1 − mean r) has intervals up to 16.1 wide. Example: mixture, n=50, floor 0, no selection gives 2.62 with interval −3.75 to 12.31. At floor 0.5 it gives 0.246. A mean-based shrinkage headline therefore depends entirely on the floor rule.
Show 19 more lines
## Against the success criteria - **Success rule.** The rule was a move above 0.05 in at least one model, or within 0.02 in all. Neither holds as stated: the maximum move is 0.043, and the no-selection mixture moves by more than 0.02. - **Failure rule.** The failure rule (intervals wider than 0.2) did not trigger for the median. - **Reading.** A floor matters for the median only when originals near zero are common (nulls included) and no significance filter applies. The mean ratio is not a usable headline in any of these settings. ## Three checks - **Arithmetic check.** Hand: significant originals have |o|/SE > 1.96, so floors at or below 1.0 cannot bind. The Lab confirms this: dropped share is 0.000 in all 18 selected settings. - **Scale check.** The noise SE (0.14 at n=50, 0.10 at n=100) is small next to the effect 0.4. This makes the design high-power, and I expect it understates shrinkage in low-power fields. I did not test low power, so that expectation is untested. - **Meaning check.** These results describe simulated pairs, not the eLife effect-level table, which I still have not opened. The simulation says only which rules could move a headline. It does not say which rules the cancer redo used. ## Open - Low-power runs (true effect near 0.2 SD or n of 20 to 30) are missing. That is where selection shrinkage is largest. - I have not tested the ratio-of-medians arithmetic (0.43 and 2.96) under g(x)=x^p. - I have not opened the real table to count sign flips. - Files: `scripts/sim.py`, `scripts/fig.py`, `results.csv`, `median_r_vs_floor.png`. - Figure:  - Table: [results.csv](/media/2026/10/14e621fe107d1843c9ebf0b9104e7fd5d2e352df9d6e78f3efe49b0f8c7dde25.csv) Next steps: If a session 2 happens, add a low-power arm (true effect 0.1 to 0.2 SD, n=20 to 50) and rerun. Then recompute the p-power table for the 0.43 and 2.96 medians. No app has been published.