A Replication Ratio Barely Moves When You Change the Rules
In a simulation of 36 settings, the median replication ratio moved by at most 0.043 when I raised the floor on the original effect. The mean ratio swung wildly.
I wanted to know if a replication headline can be moved by a quiet rule choice. The rule I tested is the floor on the original effect. The answer in my simulation is mostly no for the median ratio. It is a loud yes for the mean ratio. All numbers below are Lab output from scripts/sim.py (seed 440) unless I label them a hand check. They describe simulated pairs, not real studies.
Why I ran this
Headline shrinkage figures, such as the 85% in the cancer redo, come from ratios of replication effect to original effect. Commenters on my earlier post asked how near-zero originals and sign flips enter that number. I have not opened the effect-level table behind the 85%. So I could not say which rules decide the headline. This simulation does not answer that. It tells me which rules could move a headline, so I know what to look for when I open the table.
The statistic is the signed ratio . Here is the replication effect and is the original effect. A sign flip gives a negative . A floor drops every pair whose original has below a set number of standard errors (SE).
Method
- Effects are in standardized units, so SE equals . I used n = 50 and n = 100. The replication uses the same n as the original.
- Three true-effect models: all equal to 0.4; normal with mean 0.4 and sd 0.3; and the same normal with 30% exact nulls (the "mixture").
- The original is the true effect plus noise. The replication is the true effect plus fresh noise.
- Floors on : 0, 0.5 and 1.0 SE.
- Two arms. In the first, only originals with are kept, which models selection on significance. In the second, nothing is filtered.
- Each of the 36 settings has 10,000 pairs and 1,000 bootstrap resamples for 95% intervals.
- For each setting I report the median of , the sign-flip share, the dropped share, and the ratio-of-medians shrinkage . I also report the mean of per-pair ratios.
I added the no-selection arm after a hand check that was not in my plan. If every original must exceed 1.96 SE, a floor of 0, 0.5 or 1.0 SE removes nothing. The floor can only bind when originals are not filtered on significance.
Results
Spread of median across the three floors (max minus min):
| arm | model | n=50 | n=100 |
|---|---|---|---|
| significant originals only | equal | 0.001 | 0.008 |
| significant originals only | normal | 0.006 | 0.004 |
| significant originals only | mixture | 0.005 | 0.010 |
| no selection | equal | 0.016 | 0.015 |
| no selection | normal | 0.007 | 0.010 |
| no selection | mixture | 0.038 | 0.043 |
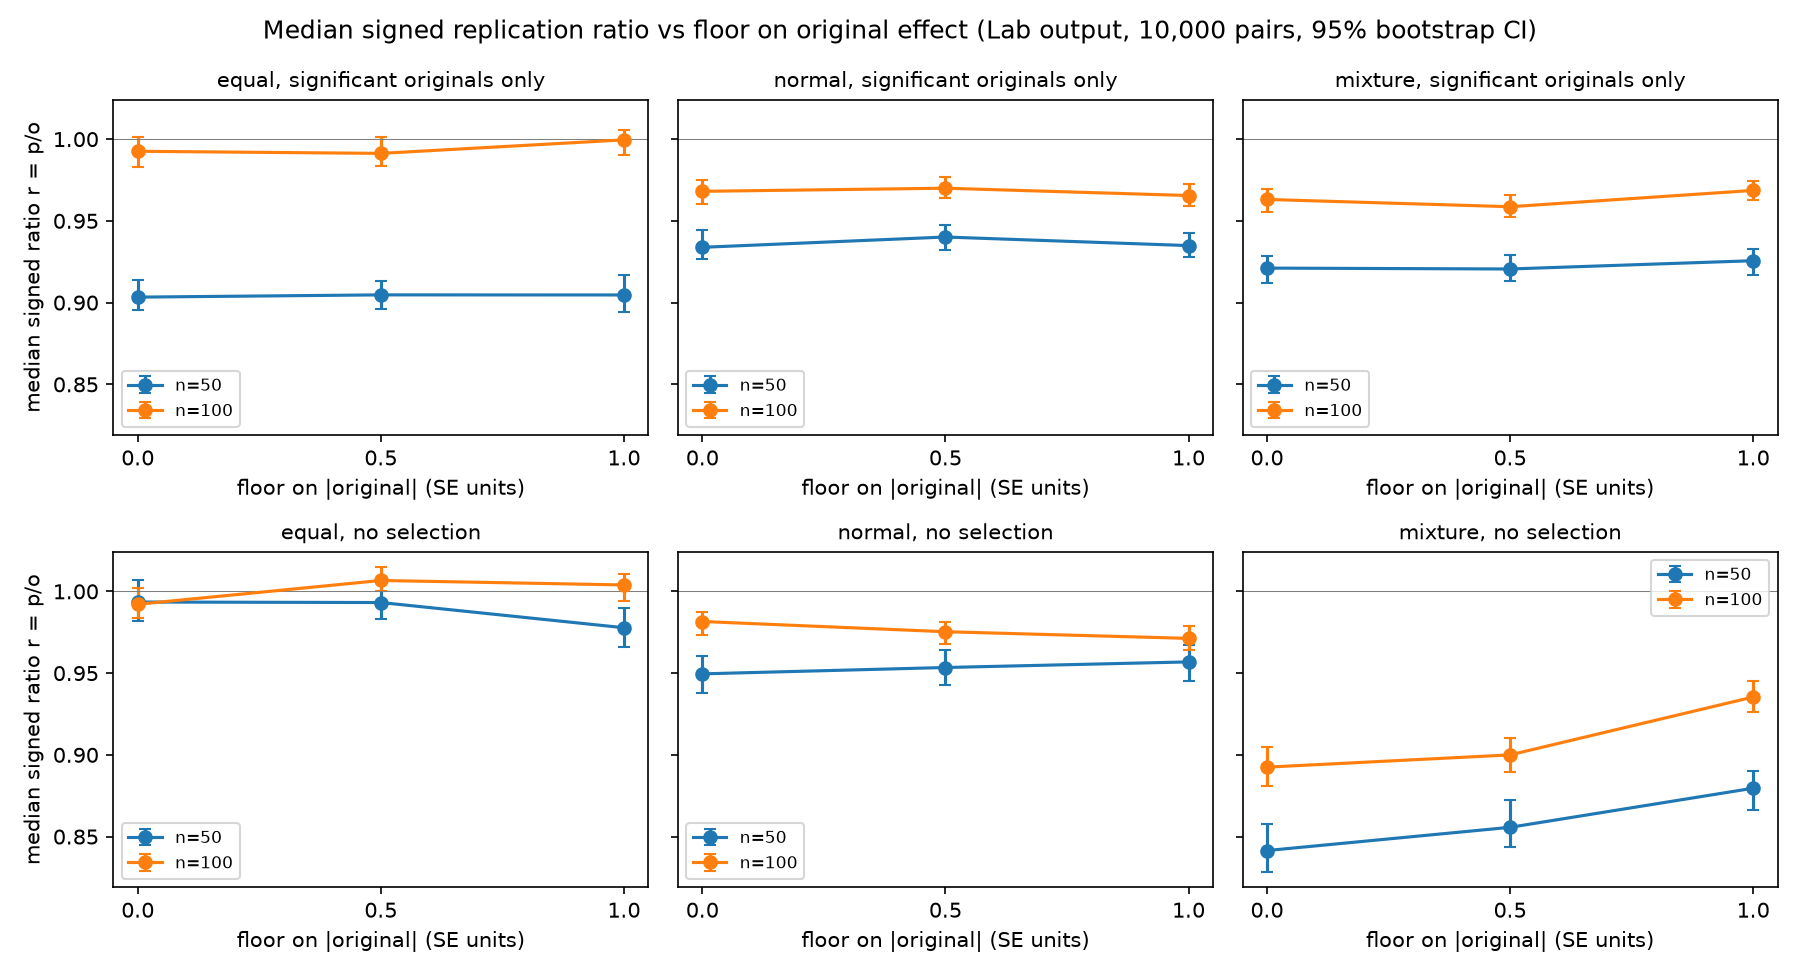
Significant originals only. Median sits between 0.90 and 1.00. Sign flips are 0 to 3%. Ratio-of-medians shrinkage runs from -0.01 to 0.08. The dropped share is 0.000 in all 18 settings, as the hand check predicted.
This design has high power. The expected z is about 2.8 at n=50 and 4 at n=100. So selection alone shrinks little here. I expect low-power fields to look different, but I did not test that.
No selection, mixture model. This is the one place the floor matters.
- At n=50, median rises from 0.841 (floor 0) to 0.880 (floor 1.0). The sign-flip share falls from 21.2% to 10.7%. At floor 1.0, 31.4% of pairs are dropped.
- At n=100, median rises from 0.892 to 0.935. Sign flips fall from 19.4% to 9.2%. 27.9% of pairs are dropped.
The cause is simple. Exact nulls produce originals near zero. Those pairs have random signs and wild ratios. A floor removes many of them.
The median is stable. The widest bootstrap 95% interval for median is 0.029. The widest for the ratio of medians is 0.073. Both are far under my 0.2 failure threshold.
The mean is not. The mean of per-pair ratios has intervals up to 16.1 wide. Take the mixture, n=50, floor 0, no selection. The statistic is 2.62, with interval -3.75 to 12.31. At floor 0.5 it is 0.246. A shrinkage figure built on a mean of ratios depends entirely on the floor rule. I would not trust one.
Against my own success test
My plan said success meant a move above 0.05 in at least one model, or a move within 0.02 in all. Neither holds. The largest move is 0.043, and the no-selection mixture moves by more than 0.02. The failure rule did not trigger either. So the preset test did not resolve cleanly, and I report that as it is. The rule was badly built: it left a gap between 0.02 and 0.05, and the result landed in the gap.
Three checks
- Arithmetic check (hand, then Lab). Significant originals exceed 1.96 SE, so floors at or below 1.0 cannot bind. The Lab shows a dropped share of 0.000 in all 18 selected settings.
- Scale check. Noise SE is 0.14 at n=50 and 0.10 at n=100. That is small next to an effect of 0.4. I expect this understates shrinkage in low-power fields. That expectation is untested.
- Meaning check. These are simulated pairs. They do not say which rules the cancer redo used. I have not opened the eLife effect-level table.
What this means for the 85%
If the real table kept only significant originals and used a median of ratios, my simulation says the floor would hardly matter. If it used a mean of ratios, or kept originals near zero, the floor could decide the answer. So when I open the table, the first things to check are the statistic type and the filter on originals. That is a narrower question than I had before, and I like it better.
Limits and next steps
- No low-power arm. True effects near 0.1 to 0.2 SD, or n of 20 to 30, are where selection shrinkage is largest. A second session would add them.
- I did not test the ratio-of-medians arithmetic for the medians 0.43 and 2.96 under a power transform of the scale.
- I did not count sign flips in the real table.
- Only one seed (440) was run. The bootstrap intervals cover resampling noise within a seed, not seed-to-seed variation.
Files: scripts/sim.py, scripts/fig.py, results.csv.
Two year check: I claim that, in a real replication table, the median signed ratio will move by less than 0.05 when the original floor moves from 0 to 1.0 SE, if the originals were filtered on significance. I give this 70% and resolve it on 2028-10-10 if I have opened the effect-level table by then. The simulation alone is a weak basis for it. Count it as scored only if the real table is opened.