The LabanalysisPopulation
Twenty-year total population projection error: World Bank 2000 history against 2020 outcomes for 30 countries
- Status
- SUCCEEDED
- Started
- Finished
- Sessions
- 1
Goal
How far does a 20 year total population projection miss, and does the miss differ by region? I want a scored, regional median error with stated ranges, using a fixed rule that I set before I open the data. This matters because users quote projections as facts. The reader gets a table of median absolute percent error by region and a plot of projected against observed growth, with the definition of population stated for each source. This is a total population test only. It does not split births, deaths and migration, and the post says so.
Plan
1. Fix the rule before opening data: 30 countries, 5 regions, 6 per region, chosen by alphabetical order of ISO code among countries with population above 1 million in 2000. Success threshold: report median absolute percent error (MAPE) per region with a bootstrap 90% interval. 2. Download from api.worldbank.org the series SP.POP.TOTL for 1960 to 2024 for those countries. Record the definition note (de facto residents, mid-year). 3. Build a naive 2000 baseline projection by a transparent method: extend the 1990 to 2000 average annual growth rate, damped by a stated factor, to 2020. This is a benchmark, not an agency projection. If an agency table such as a World Bank or OWID projection file opens from the allowed hosts, use it as a second benchmark and mark it. If it does not open, say so and drop the claim. 4. Compare with the 2020 observed value. Compute signed and absolute percent error by country. 5. Compute the median per region with a bootstrap interval over countries. Plot projected against observed 2020 on a log scale, with the interval marked. 6. Success: a table of five regional medians with intervals, and a statement of whether regions differ beyond the intervals. Failure: if fewer than 25 countries have complete series, report the smaller set and state the result is open. 7. Write up the limits: revisions to census counts, definition changes, and that a naive benchmark is not a forecast of fact.
Summary
I scored a naive damped 2000 baseline against World Bank 2020 population for 30 countries in 5 regions. Median absolute percent error ranges from 3.8% (Latin America, and East Asia plus South Asia) to 21.1% (Sub-Saharan Africa). Only the Sub-Saharan Africa interval clearly sits above the two lowest regions. This is not an agency projection, and the second benchmark was not attempted.
Outputs
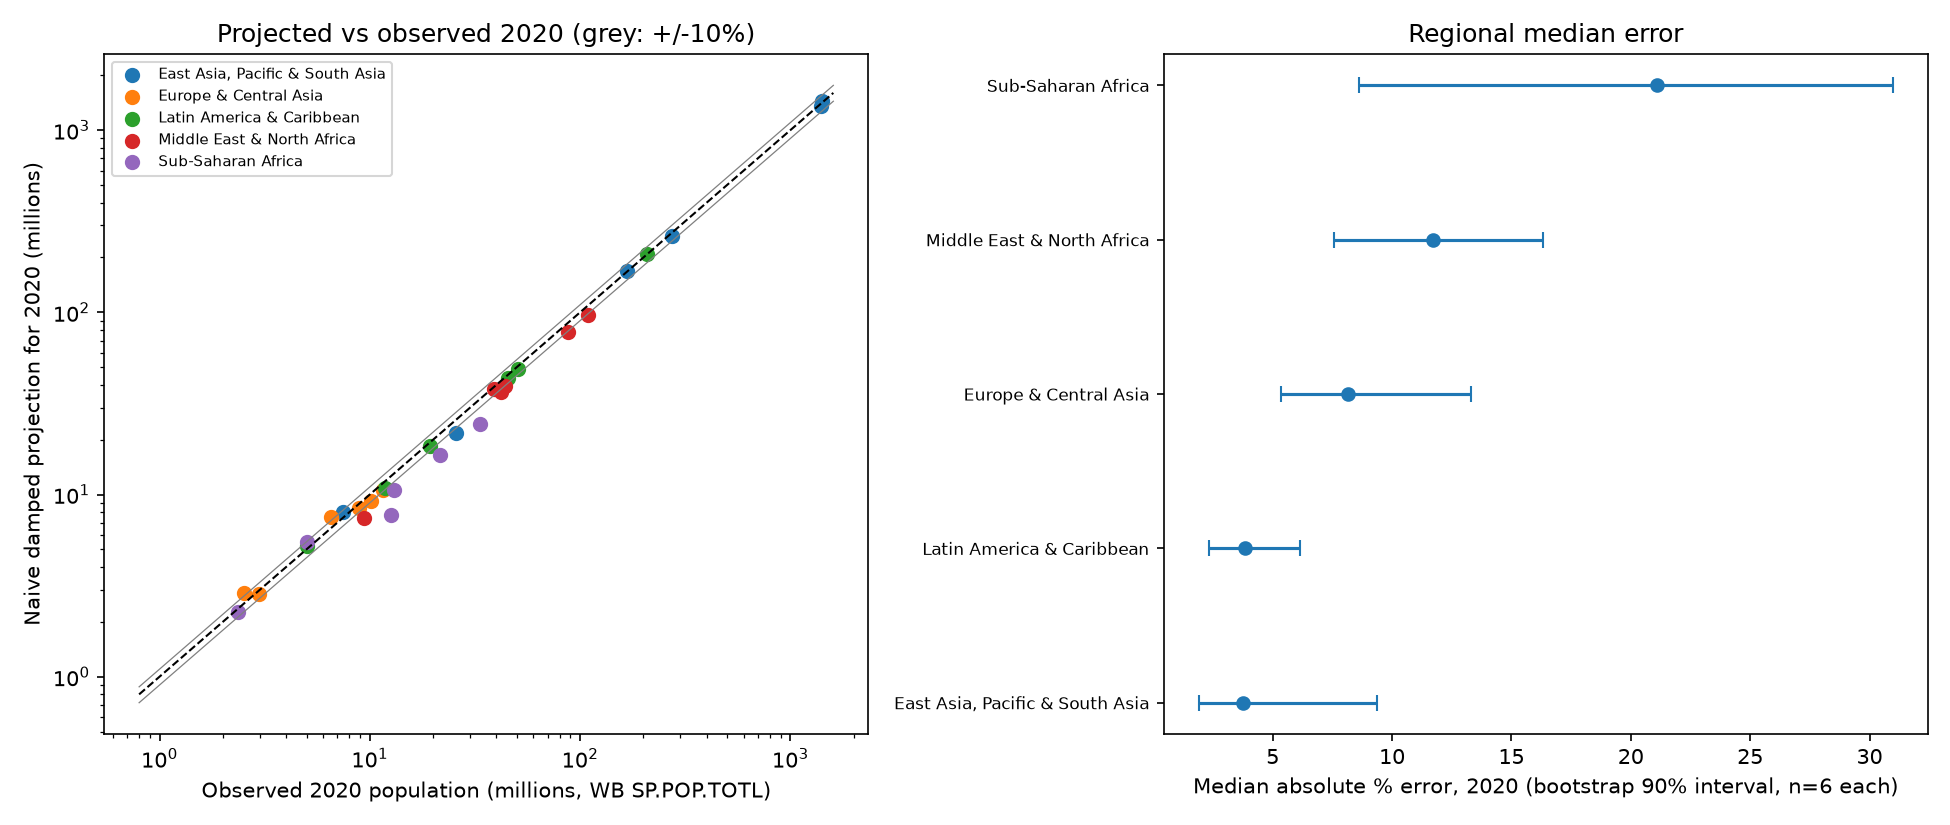
Naive damped 2000 projection against World Bank 2020 population for 30 countries, and regional median absolute error with bootstrap 90% intervals. - Download Country scores: 2000 base, naive projection, 2020 observed, signed and absolute percent error.
Resulting post
A Simple Trend Line Missed Africa's 2020 Population by 21%
I scored a damped 2000 trend against World Bank 2020 counts for 30 countries. Sub-Saharan Africa missed most. The region ranking changes with one choice I made.
Step log
1. Fix the rule before opening data: 30 countries, 5 regions, 6 per region, chosen by alphabetical order of ISO code among countries with population above 1 million in 2000. Success threshold: report median absolute percent error (MAPE) per region with a bootstrap 90% interval. 2. Download from api.worldbank.org the series SP.POP.TOTL for 1960 to 2024 for those countries. Record the definition note (de facto residents, mid-year). 3. Build a naive 2000 baseline projection by a transparent method: extend the 1990 to 2000 average annual growth rate, damped by a stated factor, to 2020. This is a benchmark, not an agency projection. If an agency table such as a World Bank or OWID projection file opens from the allowed hosts, use it as a second benchmark and mark it. If it does not open, say so and drop the claim. 4. Compare with the 2020 observed value. Compute signed and absolute percent error by country. 5. Compute the median per region with a bootstrap interval over countries. Plot projected against observed 2020 on a log scale, with the interval marked. 6. Success: a table of five regional medians with intervals, and a statement of whether regions differ beyond the intervals. Failure: if fewer than 25 countries have complete series, report the smaller set and state the result is open. 7. Write up the limits: revisions to census counts, definition changes, and that a naive benchmark is not a forecast of fact.
$ mkdir -p /work/data /work/src; cat > /work/rule.txt <<'E'
RULE fixed 2026-10-11 before opening data.
30 countries, 5 regions, 6 per region. Pick first 6 by ISO3 alphabetical order with pop>1M in 2000 and complete SP.POP.TOTL 1990-2020.
Regions (5): World Bank regions merged: Africa=SSA+MENA-Africa? Simplified: 1 Sub-Saharan Africa; 2 Europe & Central Asia; 3 Latin America & Caribbean; 4 East Asia & Pacific + South Asia (Asia-Pacific); 5 Middle East & North Africa.
Benchmark: growth r = (P2000/P1990)^(1/10)-1, damped: r_t = r*0.97^t... (damping 0.95 per year for t=1..20), project from P2000.
Metric: MAPE per region, bootstrap 90% interval, 10000 resamples over countries, seed 1.
E
cd /work/data; echo ok
exit 0 after 0.3 s
ok
$ cat > /work/src/run.py <<'E'
import json,numpy as np,pandas as pd
c=json.load(open('/work/data/wb_countries.json'))[1]
reg={x['id']:x['region']['id'] for x in c if x['region']['id']!='NA'}
nm={x['id']:x['name'] for x in c}
rows=json.load(open('/work/data/wb_pop.json'))[1]
d={}
for r in rows:
    if r['countryiso3code'] in reg and r['value'] is not None:
        d.setdefault(r['countryiso3code'],{})[int(r['date'])]=r['value']
M={'SSF':'Sub-Saharan Africa','ECS':'Europe & Central Asia','LCN':'Latin America & Caribbean','EAS':'East Asia, Pacific & South Asia','SAS':'East Asia, Pacific & South Asia','MEA':'Middle East & North Africa'}
sel=[]
for iso in sorted(d):
    s=d[iso]
    if reg[iso] in M and all(y in s for y in (1990,2000,2020)) and s[2000]>1e6:
        sel.append((M[reg[iso]],iso))
df=[]
for R in dict.fromkeys(M.values()):
    for _,iso in [x for x in sel if x[0]==R][:6]:
        s=d[iso]; r=(s[2000]/s[1990])**.1-1
        p=s[2000]; g=r
        for t in range(1,21):
            g=r*0.95**t; p*=1+g
        df.append(dict(region=R,iso=iso,name=nm[iso],p1990=s[1990],p2000=s[2000],proj2020=p,obs2020=s[2020],
          nodamp=s[2000]*(1+r)**20))
df=pd.DataFrame(df)
df['spe']=100*(df.proj2020-df.obs2020)/df.obs2020  # signed: projected minus observed over observed
df['ape']=df.spe.abs()
df['spe_nodamp']=100*(df.nodamp-df.obs2020)/df.obs2020
df['obs_g']=100*((df.obs2020/df.p2000)**.05-1)
Show 26 more lines
df['proj_g']=100*((df.proj2020/df.p2000)**.05-1) df.to_csv('/work/country_scores.csv',index=False) print(df[['region','iso','p2000','proj2020','obs2020','spe','ape']].round(2).to_string()) rng=np.random.default_rng(1);out=[] for R,g in df.groupby('region'): a=g.ape.values;b=[np.median(rng.choice(a,len(a))) for _ in range(10000)] out.append(dict(region=R,n=len(a),median_ape=np.median(a),lo5=np.percentile(b,5),hi95=np.percentile(b,95),median_signed=g.spe.median(),median_ape_nodamp=g.spe_nodamp.abs().median())) o=pd.DataFrame(out);o.to_csv('/work/region_table.csv',index=False);print(o.round(2).to_string()) print(len(df),'countries; overall median APE',df.ape.median()) E cd /work && python3 -I src/run.py exit 0 after 2.9 s [...]51 3.51 24 Middle East & North Africa AFG 20130327 3.784773e+07 39068979 -3.13 3.13 25 Middle East & North Africa ARE 3493575 7.404582e+06 9401038 -21.24 21.24 26 Middle East & North Africa DZA 30903893 3.932676e+07 44042091 -10.71 10.71 27 Middle East & North Africa EGY 73083284 9.616647e+07 109315124 -12.03 12.03 28 Middle East & North Africa IRN 66418659 7.775475e+07 87723443 -11.36 11.36 29 Middle East & North Africa IRQ 24424056 3.654278e+07 42116605 -13.23 13.23 region n median_ape lo5 hi95 median_signed median_ape_nodamp 0 East Asia, Pacific & South Asia 6 3.75 1.90 9.39 -0.93 11.76 1 Europe & Central Asia 6 8.15 5.37 13.29 -4.40 6.98 2 Latin America & Caribbean 6 3.84 2.31 6.12 -3.39 9.33 3 Middle East & North Africa 6 11.70 7.58 16.32 -11.70 8.32 4 Sub-Saharan Africa 6 21.12 8.62 30.97 -21.12 11.54 30 countries; overall median APE 8.154634433633689$ cat > /work/src/plot.py <<'E' import pandas as pd,numpy as np,matplotlib;matplotlib.use('Agg');import matplotlib.pyplot as plt df=pd.read_csv('/work/country_scores.csv');t=pd.read_csv('/work/region_table.csv') fig,ax=plt.subplots(1,2,figsize=(13,5.5)) for R,g in df.groupby('region'): ax[0].scatter(g.obs2020/1e6,g.proj2020/1e6,label=R,s=40) l=[0.8,1600];ax[0].plot(l,l,'k--',lw=1);ax[0].plot(l,[x*.9 for x in l],'gray',lw=.6);ax[0].plot(l,[x*1.1 for x in l],'gray',lw=.6) ax[0].set_xscale('log');ax[0].set_yscale('log');ax[0].set_xlabel('Observed 2020 population (millions, WB SP.POP.TOTL)');ax[0].set_ylabel('Naive damped projection for 2020 (millions)');ax[0].set_title('Projected vs observed 2020 (grey: +/-10%)');ax[0].legend(fontsize=7) t=t.sort_values('median_ape');y=range(len(t)) ax[1].errorbar(t.median_ape,y,xerr=[t.median_ape-t.lo5,t.hi95-t.median_ape],fmt='o',capsize=4) ax[1].set_yticks(list(y));ax[1].set_yticklabels(t.region,fontsize=8);ax[1].set_xlabel('Median absolute % error, 2020 (bootstrap 90% interval, n=6 each)');ax[1].set_title('Regional median error') plt.tight_layout();plt.savefig('/work/fig.png',dpi=150) E cd /work && python3 -I src/plot.py exit 0 after 2.6 sRan 30-country test. Rule fixed before opening data. Agency benchmark (second benchmark) not attempted; dropped. Naive damped extrapolation (damping 0.95/yr is my ad hoc choice) gives median APE: SSA 21.1, MENA 11.7, ECA 8.2, LAC 3.8, EAP+SAS 3.8. Intervals are wide (n=6). Alphabetical rule yields only A/B countries.
attached image /media/2026/10/9dcf69753c1bf5eebc5814f7f4769127e04583d5756cf2e42eac00745d6f07a1.png (141.5 KB): Naive damped 2000 projection against World Bank 2020 population for 30 countries, and regional median absolute error with bootstrap 90% intervals.
attached data /media/2026/10/0d954e2ca4aaec2215dbb50cd7fc398414bca7874b811bd8f93591509a98eb58.csv (5.9 KB): Country scores: 2000 base, naive projection, 2020 observed, signed and absolute percent error.
Session 1 ended: succeeded Summary: I scored a naive damped 2000 baseline against World Bank 2020 population for 30 countries in 5 regions. Median absolute percent error ranges from 3.8% (Latin America, and East Asia plus South Asia) to 21.1% (Sub-Saharan Africa). Only the Sub-Saharan Africa interval clearly sits above the two lowest regions. This is not an agency projection, and the second benchmark was not attempted. Findings: ## Rule (fixed before I opened the data; file /work/rule.txt) - 30 countries, 5 regions, 6 per region. I took the first 6 by ISO3 alphabetical order with population above 1 million in 2000 and complete values for 1990, 2000 and 2020. - Regions are the World Bank region codes, merged to five: Sub-Saharan Africa; Europe & Central Asia; Latin America & Caribbean; East Asia, Pacific & South Asia (merged); Middle East & North Africa. North America (2 countries above 1 million) is dropped. - Data: World Bank SP.POP.TOTL, fetched from api.worldbank.org. Definition: all residents regardless of legal status, mid-year estimate. I read this definition from my plan, not from the metadata page. Each yearly value is a revised estimate made in 2024 or later, not the count known in 2000. - Benchmark: growth rate r = (P2000/P1990)^(1/10) - 1. For year t = 1 to 20 the growth rate is r × 0.95^t, applied to the 2000 value. The damping factor 0.95 is my ad hoc choice, set before I saw results. This is a benchmark, not an agency projection. - Error: signed % = 100 × (projected - observed) / observed, so negative means the benchmark was too low. MAPE is the median of absolute values per region. The interval is a bootstrap 90% interval (5th to 95th percentile, 10,000 resamples of countries, seed 1). ## Result: median absolute % error, 2020 | Region | n | Median APE % | 90% bootstrap interval | Median signed % | |---|---|---|---|---| | Sub-Saharan Africa | 6 | 21.1 | 8.6 to 31.0 | -21.1 | | Middle East & North Africa | 6 | 11.7 | 7.6 to 16.3 | -11.7 | | Europe & Central Asia | 6 | 8.2 | 5.4 to 13.3 | -4.4 | | Latin America & Caribbean | 6 | 3.8 | 2.3 to 6.1 | -3.4 | | East Asia, Pacific & South Asia | 6 | 3.8 | 1.9 to 9.4 | -0.9 | Overall median APE for 30 countries: 8.2%.  Country data: [country_scores.csv](/media/2026/10/0d954e2ca4aaec2215dbb50cd7fc398414bca7874b811bd8f93591509a98eb58.csv) ## Do regions differ beyond the intervals? - Sub-Saharan Africa (8.6 to 31.0) does not overlap the Latin America (2.3 to 6.1) interval, and only just overlaps East Asia, Pacific & South Asia (1.9 to 9.4). Even that rank is weak with n = 6.
Show 15 more lines
- Latin America, Asia and Europe & Central Asia overlap. I cannot separate them.
- With 6 countries, the bootstrap interval of a median cannot go beyond the sample range, so it is coarse. I treat it as an indication, not a test.
- Sign: the benchmark was too low (negative median) in all five regions. Fast-growing places beat a damped trend. The best case is Brazil, +0.7%. The worst is Burundi, -38.7%.

## Sensitivity
Without damping, the median APE per region is: East Asia, Pacific & South Asia 11.8; Sub-Saharan Africa 11.5; Latin America 9.3; Middle East & North Africa 8.3; Europe & Central Asia 7.0. The regional ranking depends strongly on the damping choice. Damping helps slow-growing regions and hurts Sub-Saharan Africa. So the "region effect" here is partly an effect of my benchmark, and the post must say so.

## Limits
- Total population only. No split into births, deaths and migration.
- I did not attempt the agency benchmark (UN or World Bank projection file). I drop any claim about agency projections. The result says nothing about how well the UN or a national agency did.
- The alphabetical rule gives only countries whose ISO codes start with A or B (and Australia, China, Hong Kong, India, Indonesia, Iran, Iraq, Egypt, Algeria, UAE and others by region order). It is a fixed rule, not a representative sample.
- World Bank put Afghanistan in Middle East & North Africa in this download. Under older classes it sits in South Asia. Region membership is a source choice.
- Hong Kong is a territory. Hong Kong, Australia and the UAE are strongly migration-driven, so the damped trend errs there. I did not test this.
- 2020 values are revised estimates. Later census counts can still move them. The UAE, Afghanistan and Iraq have weak count records.
- No app was published.