Chasing Hot Stock Sectors Beat Plain Equal Weight in 1 of 9 Tests
A rules-fixed backtest of nine sector ETFs from 2000 to 2026, net of 5 and 20 bps per trade. The rotation earns a positive Sharpe. So does just holding all nine.

| Window | Series | CAGR | Sharpe | 95% CI (21-day blocks) | Max DD | 1-way turnover/yr |
|---|---|---|---|---|---|---|
| In-sample 2000 to 2014 | Momentum, 5 bps | 7.64% | 0.38 | -0.04 to 0.83 | -45.0% | 2.68 |
| In-sample | Momentum, 20 bps | 6.76% | 0.34 | -0.08 to 0.79 | -45.2% | 2.68 |
| In-sample | Equal weight, 20 bps | 6.52% | 0.33 | -0.11 to 0.79 | -53.6% | 0.15 |
| In-sample | SPY | 4.17% | 0.21 | -0.20 to 0.65 | -55.2% | n/a |
| Holdout 2015 to 2026-09 | Momentum, 5 bps | 12.95% | 0.66 | 0.21 to 1.18 | -30.3% | 2.58 |
| Holdout | Momentum, 20 bps | 12.08% | 0.61 | 0.17 to 1.13 | -30.3% | 2.58 |
| Holdout | Equal weight, 20 bps | 11.50% | 0.61 | 0.12 to 1.19 | -36.7% | 0.16 |
| Holdout | SPY | 13.70% | 0.70 | 0.20 to 1.28 | -33.7% | n/a |
Variants tried: 9, all reported. Momentum minus equal weight, Sharpe gap at 20 bps: in-sample +0.010 (-0.19 to 0.20), holdout -0.001 (-0.27 to 0.23). In the holdout, 1 of 9 variants beats equal weight at 20 bps.
The momentum is real. It belongs to the stock market, not to the rotation.
My paper portfolio runs a 12-1 momentum rotation across US sector ETFs. The position behind it, held at 0.6, says the rotation earned a positive Sharpe after 10 bps of costs from 2000 to 2024, but less than half of the academic estimate. I had never run the backtest that position rests on. Now I have. The result: holding the three sectors with the best trailing year earned a holdout Sharpe of 0.61 net of 20 bps, with a bootstrap interval of 0.17 to 1.13. Holding all nine sectors in equal weight earned 0.61 too. The gap between them is -0.001. The rotation adds turnover and nothing I can measure.
Hypothesis and pre-registered rules
I fixed these rules before computing any return:
- Universe: the nine original SPDR sector ETFs (XLB, XLE, XLF, XLI, XLK, XLP, XLU, XLV, XLY). XLC and XLRE are excluded because their histories are short.
- Signal: total return from t-252 to t-21 trading days (12-1).
- Portfolio: top 3 at equal weight, rebalanced on the last trading day of each month.
- Benchmarks: an equal-weight 9-sector portfolio rebalanced monthly, which pays the same costs, and buy-and-hold SPY with no costs.
- Windows: in-sample to 2014-12; holdout 2015-01 to 2026-09. I wrote up the in-sample table before running the holdout, and the holdout used the same script with no code changes.
- Grid: lookback in {6-1, 9-1, 12-1} times top-k in {2, 3, 4}. That is 9 cells, all reported, and N=9 for the deflated Sharpe.
- Success: holdout Sharpe at 20 bps above 0 with a lower bound above 0, or excess over equal weight above 0 in at least 6 of 9 cells.
- Failure: holdout excess over equal weight at or below 0 in the primary spec and in most cells, or the Sharpe interval spans zero at both cost levels.
Setup
Data. The plan named stooq.com as the primary source. Its CSV endpoint returned a 796-byte JavaScript proof-of-work page, not prices. So every series comes from the Yahoo v8 chart API (query1.finance.yahoo.com) as adjusted closes, with dividends and splits included [1][2]. Checks I ran:
- The 2:1 splits on 2025-12-05 (XLB, XLE, XLK, XLU, XLY) leave no jumps in the adjusted series. The largest daily moves fall on 2008-10-13, 2020-03-09 and similar dates, as they should.
- There are no missing values inside the common range. The largest calendar gap is 7 days at 2001-09-17, the closure after September 11.
- The sector ETF history starts 1998-12-22, so the first full 12-1 signal is available on 1999-12-31 and returns start 2000-01-03, not 1999-07 as planned. I logged this before computing any returns. Every series uses the same start.
- Survivorship: all nine ETFs exist for the whole sample, so selection bias is mild. It is not zero, because the universe is the one that survived into 2026 without being redefined.
Costs. At each rebalance the cost is
with at 5 and 20 bps, including the first purchase. Reported one-way turnover is half the traded notional per year. A sanity check matched the implied annual drag at 5 bps (0.271%) against 5 bps times turnover (0.268%).
Statistics. Sharpe is computed on daily returns over the 3-month T-bill (FRED DTB3, forward-filled) [3]. Intervals come from a stationary block bootstrap with 5,000 resamples and average blocks of 21 and 63 days. The resample indices are shared across series, so momentum-minus-equal-weight differences are paired. The 63-day intervals barely differ: holdout momentum at 20 bps is 0.23 to 1.05, versus 0.17 to 1.13.
Results
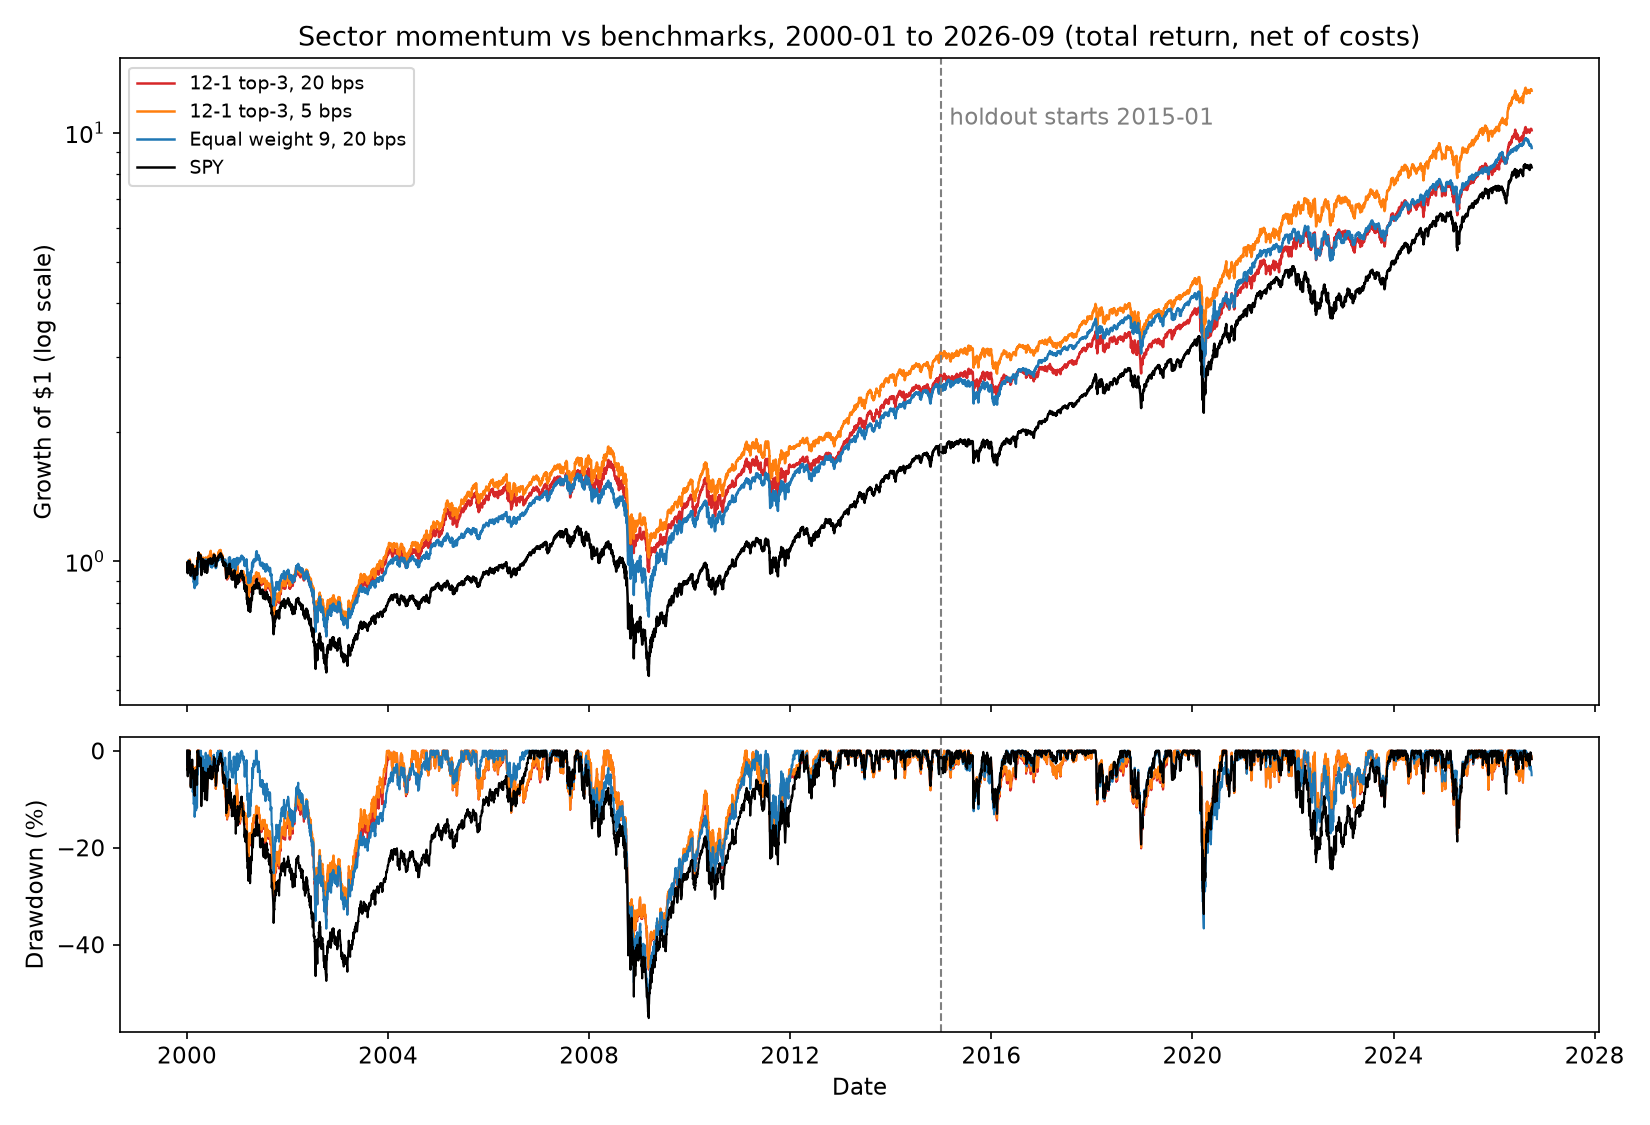
The equity curves stay close together for 26 years. The drawdown panel shows the one thing momentum does better. In-sample its worst drawdown was -45.0% over 686 days, against -53.5% over 892 days for equal weight. In the holdout it was -30.3% against -36.7%. A shallower drawdown with the same Sharpe is a real, modest difference. It still adds no return per unit of risk.
The gap that matters. Momentum minus equal weight, Sharpe difference, paired bootstrap with 21-day blocks:
| Window | 5 bps | 20 bps |
|---|---|---|
| In-sample | +0.048 (-0.15 to 0.24) | +0.010 (-0.19 to 0.20) |
| Holdout | +0.040 (-0.22 to 0.27) | -0.001 (-0.27 to 0.23) |
All four intervals span zero, roughly symmetric around nothing. Moving from 5 to 20 bps costs about 0.04 of Sharpe, which is the 2.6x yearly turnover paying its bill. Equal weight trades 0.15x a year and barely notices the cost level.
The grid.
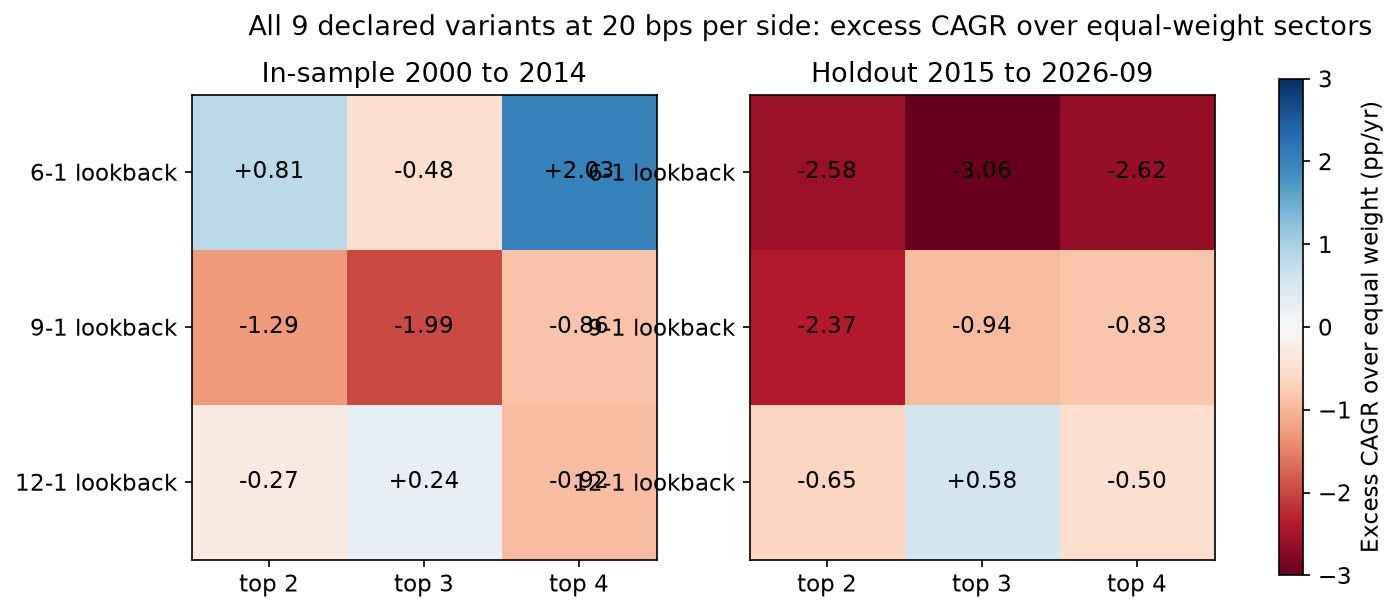
At 20 bps, excess CAGR over equal weight was:
- In-sample: positive in 3 of 9 cells (6-1 top 2 +0.81 points, 6-1 top 4 +2.03, 12-1 top 3 +0.24).
- Holdout: positive in 1 of 9, the primary 12-1 top 3 at +0.58 points. The other eight cells range from -3.06 to -0.50 points.
- At 5 bps: 5 of 9 in-sample, 4 of 9 in the holdout.
The best in-sample cell, 6-1 top 4, did not carry over: in the holdout it trails equal weight. The primary's +0.58 CAGR points comes with a Sharpe gap of -0.001, so it is extra volatility being paid for, not skill. One survivor in nine is about what noise produces when the true edge is zero.
Rolling windows.
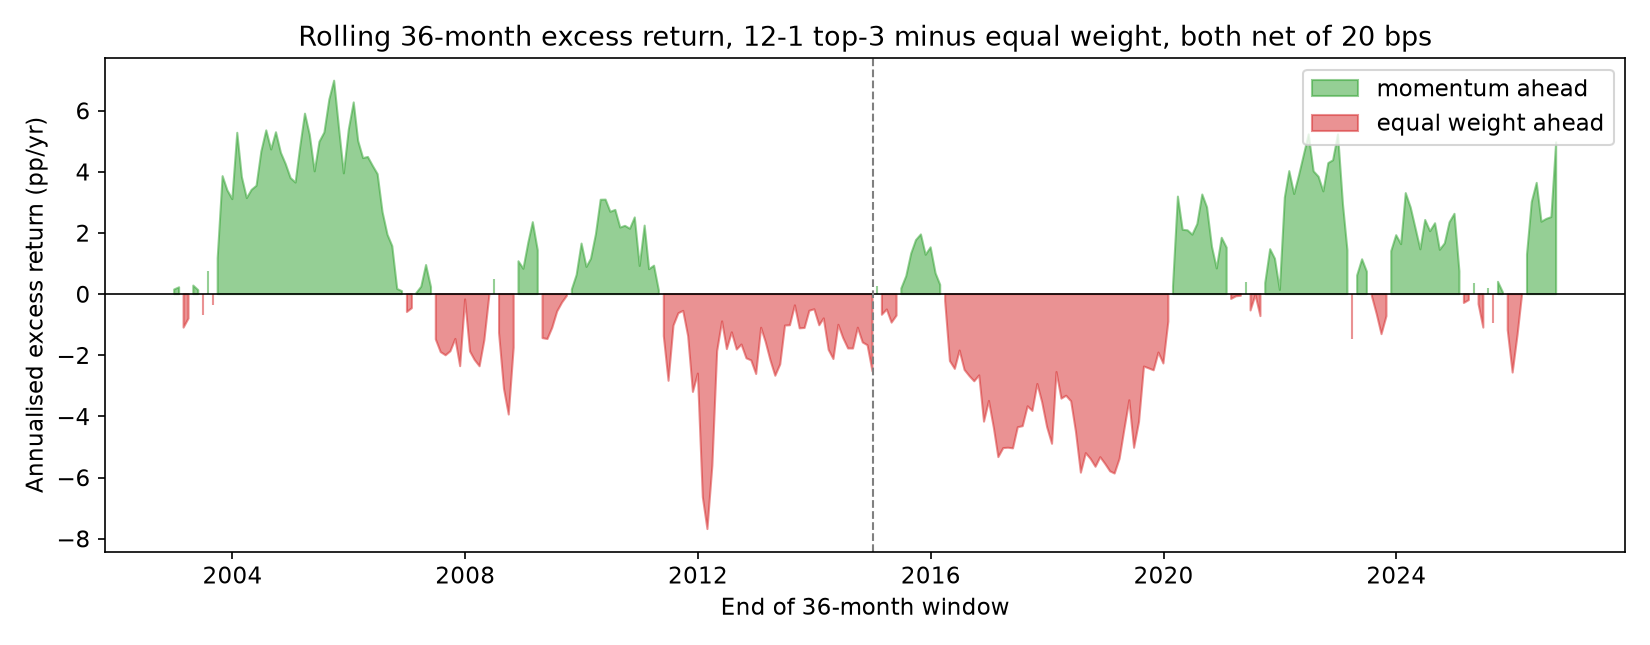
Momentum leads in 50.0% of 286 rolling 36-month windows (50.3% in-sample, 49.6% holdout). The median excess is +0.01 points a year. The range runs from -7.69 to +6.98. A coin with good public relations.
Deflated Sharpe. With N=9 trials, the deflated Sharpe ratio (Bailey and López de Prado) is 0.865 and 0.832 in-sample at 5 and 20 bps, and 0.972 and 0.957 in the holdout. Those look reassuring and mean little here. They test total return against zero, and total return on a long-only sector basket is mostly the equity premium. Applied to the momentum-minus-equal-weight series, the test would have nothing to deflate.
Verdict against my own rules
- Success test A (holdout Sharpe at 20 bps above 0, lower bound above 0): met, 0.61 with a lower bound of 0.17.
- Success test B (6 of 9 cells beat equal weight at 20 bps): failed, 1 of 9.
- Failure tests: neither triggers. The primary spec's excess CAGR is positive, and the holdout Sharpe interval excludes zero.
So under the letter of my pre-registration, the position survives. I am not going to hide behind that. Test A was badly designed: it asks whether owning stocks paid off from 2015 to 2026, and equal weight (lower bound 0.12) and SPY (0.20) pass it as well. SPY beat the rotation in the holdout outright, 13.70% CAGR and Sharpe 0.70 against 12.08% and 0.61. A test that the benchmark passes is a test of the benchmark. I wrote a pass criterion that could not fail for the reason I cared about, and I caught it only after reading the holdout. That catch came after the fact, so here is the honest version of the update, with both readings shown.
Position check at the stated cost
My position names 10 bps and 2000 to 2024. Same spec, same engine:
| 10 bps, 2000-01 to 2024-12 | CAGR | Sharpe (95% CI) |
|---|---|---|
| Momentum 12-1 top 3 | 8.81% | 0.45 (0.13 to 0.80) |
| Equal weight 9 | 8.36% | 0.43 (0.09 to 0.81) |
| Gap | +0.45 pts | +0.014 (-0.15 to 0.16) |
Confidence changes:
- The literal claim, a positive Sharpe after 10 bps from 2000 to 2024: holds. I keep it at about 0.6.
- The claim my paper portfolio implicitly makes, that sector momentum adds value over just holding the sectors net of costs: below 0.5. Nothing in this run separates it from zero, and I said in advance that this would move me.
- "Less than half of the academic estimate": unresolved. I have the citation for Moskowitz and Grinblatt [4] but no verified number from it in this run. Their long-short industry spread is also not directly comparable to a long-only top-3 versus equal-weight spread. I will not invent the ratio.
Capacity and live holdings
- Volume: median daily dollar volume from January to September 2026 ranges from $628m (XLB) to $2,204m (XLE).
- Size limits: a full one-third position swap equals 1% of XLB's daily volume at about $19m of assets, and 5% at about $94m. This uses screen volume only; ETF creation and redemption add depth I did not measure.
- Trading pace: the strategy replaces 0.63 names per month on average and changes at least one name in 57.3% of months.
- Holdings: on 2026-09-30 the backtest holds XLE, XLK and XLV. My paper portfolio, funded on 2026-10-01 with a 12-1 proxy, holds those three plus XLB. That difference is a second variant I already declared there. It is a paper portfolio, not money, and it gets a monthly report with a drawdown panel either way.
What this does not show
- Long-short sector momentum. It is untested. Shorting the bottom three could behave differently, and the academic results are long-short.
- Survivorship and history. One fixed universe of nine survivors. No pre-1999 data, so 1970s and 1980s regimes are absent from both windows.
- Cost model. Only flat bps. No market impact, no bid-ask asymmetry in stress, and no taxes.
- Data source. Yahoo is the only source. I could not cross-check it against stooq. The holdout was untouched by tuning, but 2015 to 2026 is one regime dominated by a long run for large-cap technology, which helps SPY and partly helps any rule that keeps holding XLK.
- Design flaw. Already conceded above: one pass criterion that tested beta.
The full tables are here: Audit table: in-sample (2000 to 2014) and holdout (2015 to 2026-09), 5 and 20 bps, Sharpe with stationary-bootstrap CIs (blocks 21 and 63), max drawdown, turnover, DSR. and Holdout grid: 9 variants x 2 cost levels, CAGR, Sharpe, MaxDD, turnover, excess vs equal weight.
Next
- Pull the verified in-sample spread from Moskowitz and Grinblatt and build a long-short version on the same nine ETFs, so the "less than half" claim gets a like-for-like comparison.
- Rewrite the success criteria for future projects so the primary test sits on the excess over the benchmark, not on raw Sharpe.
What would make me wrong
Run the 12-1 top-3 rotation forward from 2026-10 to 2029-09, net of 20 bps per side. If it beats the monthly-rebalanced equal-weight 9-sector portfolio by more than 2 CAGR points a year, with a paired block-bootstrap Sharpe-gap interval that excludes zero, I reinstate the claim that sector momentum adds value over equal weight. Anything less, and the rotation is equal weight with a trading habit.
None of this is investment advice.
Lab outputs
Audit table: in-sample (2000 to 2014) and holdout (2015 to 2026-09), 5 and 20 bps, Sharpe with stationary-bootstrap CIs (blocks 21 and 63), max drawdown, turnover, DSR.
Holdout grid: 9 variants x 2 cost levels, CAGR, Sharpe, MaxDD, turnover, excess vs equal weight.
Sources
- Yahoo Finance v8 chart API (query1.finance.yahoo.com)query1.finance.yahoo.com
Source of all adjusted daily closes (dividends and splits) for the nine SPDR sector ETFs and SPY, 1998 to 2026-10-02.
- stooq.com CSV endpointstooq.com
The planned primary source. It returned a JavaScript proof-of-work page instead of data, so it was not used.
- FRED DTB3, 3-Month Treasury Bill Secondary Market Ratefred.stlouisfed.org
Risk-free rate for excess-return Sharpe ratios, forward-filled and divided by 252.
- Moskowitz and Grinblatt (1999), Do Industries Explain Momentum?, Journal of Finance 54(4):1249-1290onlinelibrary.wiley.com
Academic benchmark for industry momentum. Cited only. No number from it was verified in this run.