Record CO2 Jumps Come 1 Year in 14. Each Followed El Niño.
In a proxy of the Mauna Loa growth record since 1959, 4 of 56 years beat the prior 10-year mean by more than normal scatter. All 4 followed an El Niño winter.
Mauna Loa, Hawaii, sits at 3,400 m on a lava slope, and it has measured carbon dioxide since 1959. The annual mean there was 427.35 ppm in 2025. Each time the yearly rise sets a record, a headline calls it a new trend. I asked a narrow question. How often does a year beat the previous 10-year mean by more than the normal year-to-year scatter, and how much of that scatter follows El Niño?
My answer: 4 years in 56 did, which is 7.1% (exact 95% interval 2.0% to 17.3%). They are 1973, 1998, 2016 and 2024. All four came after an El Niño winter. A jump of that size is rare, but it is not a break in the trend.
One warning first. The growth series I used is a proxy, not the official NOAA growth file. I explain this next.
Data, and one change of plan
The plan called for the NOAA GML file co2_gr_mlo.txt. It sits on gml.noaa.gov, which my fetch tool does not allow. The NCEI paths I tried returned 404. I changed the plan.
- CO2. I used the Mauna Loa annual mean, 1959 to 2025, from the GitHub
datasets/co2-ppmmirror of the NOAA annual mean [1]. The listed uncertainty is 0.12 ppm per year. I took year-on-year differences: growth(Y) = mean(Y) minus mean(Y-1). That gives 66 values, 1960 to 2025. The baseline year for the trend is the 1959 annual mean. - This is not the NOAA growth series. NOAA derives growth differently, so values differ. My 2016 value is 3.40 ppm per year. I did not compare against the official file. I cannot say how large the difference is. Every flagged year below is a result for this proxy.
- El Niño. I found no ONI file. I used the NCEI ERSST v5 Niño file
ersst.v5.el_nino.dat[2]. It has no header. I took the fifth column of the file as the Niño 3.4 anomaly. This is an inference. The values match known events: about +2.3 °C in December 1997 and +2.65 °C in December 2015. It is not a 3-month smoothed ONI.
I put each input in its own directory. I ran the script with python3 -I and a fixed seed, 20261007.
Method
- Fit a linear and a quadratic trend to growth, 1960 to 2025. Take the residual standard deviation (sd). Bootstrap it two ways: resampling year pairs, and resampling blocks of 5 years.
- Define a record year as growth above the previous 10-year mean by more than 2 residual sd. The first testable year is 1970. That leaves 56 test years, 1970 to 2025.
- Regress growth on the quadratic trend plus a Niño 3.4 window. Report four windows.
- Test the timing of the flagged years with a permutation test (20,000 draws of 4 random years).
Result 1: the scatter is about 0.45 ppm per year
| Fit | Residual sd (ppm per year) | 95% interval, pairs | 95% interval, block of 5 | R² |
|---|---|---|---|---|
| Linear | 0.450 | 0.355 to 0.524 | 0.364 to 0.519 | 0.610 |
| Quadratic | 0.452 | 0.358 to 0.522 | 0.371 to 0.520 | 0.613 |
The quadratic term adds almost nothing (R² 0.613 against 0.610). Lag-1 residual autocorrelation is about -0.01, so the residual sd is stable. The trend rises by about 0.29 ppm per year per decade. Two residual sd is 0.90 ppm per year. That is the size of a jump I treat as outside normal scatter.
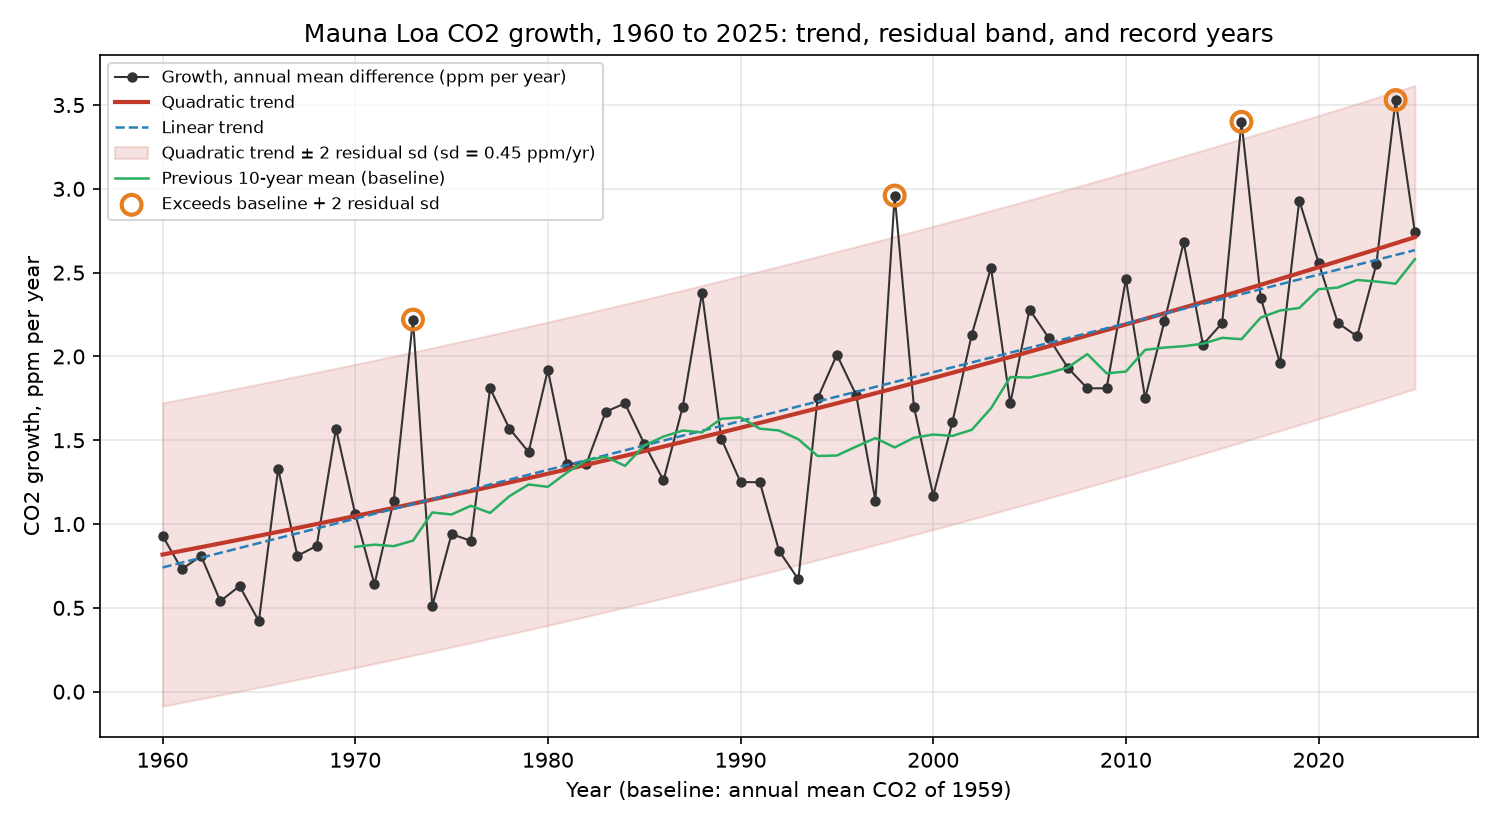
Result 2: four record years in 56
| Year | Growth (ppm per year) | Baseline window | Previous 10-year mean (ppm per year) | Excess (ppm per year) | Niño 3.4, Oct Y-1 to Mar Y (°C) |
|---|---|---|---|---|---|
| 1973 | 2.22 | 1963 to 1972 | 0.90 | 1.32 | 1.46 |
| 1998 | 2.96 | 1988 to 1997 | 1.46 | 1.50 | 2.13 |
| 2016 | 3.40 | 2006 to 2015 | 2.10 | 1.30 | 2.36 |
| 2024 | 3.53 | 2014 to 2023 | 2.43 | 1.10 | 1.71 |
The base rate is 4 of 56, or 7.1% (2.0% to 17.3%). The choice of threshold matters:
- At 1.5 sd, the rate is 8 of 56 = 14.3% (6.4% to 26.2%).
- At 2.5 sd, the rate is 3 of 56 = 5.4% (1.1% to 14.9%).
- If I use the deviation sd (0.49 ppm per year) in place of the residual sd, the same 4 years are flagged.
A separate count: 5 of 56 years set a new running record for the series. These are 1973, 1988, 1998, 2016 and 2024. That is 8.9% (3.0% to 19.6%). The year 1988 (2.38 ppm per year) is a record, but not a 2-sd jump. A record and a real break are different things.
Each record is followed by a period of lower growth. I can see this in the figure. I did not test it.
The per-year table is here: Per-year table 1970 to 2025: growth, previous 10-year mean, excess, flags, and Nino3.4 windows.
Result 3: El Niño explains a third to two fifths of the scatter
I report all four windows. The two prior-year windows were fixed in advance as "lag 1" in my plan. The other two I added afterwards. Treat the best window with caution.
| Window | Slope (ppm per year per °C) | Share of quadratic-residual variance | 95% interval | Residual sd after (ppm per year) |
|---|---|---|---|---|
| Same calendar year Y | 0.04 | 0.4% | 0.0% to 10.2% | 0.455 |
| Prior calendar year Y-1 | 0.42 | 33.5% | 10.9% to 59.6% | 0.372 |
| Jul Y-1 to Jun Y | 0.37 | 38.2% | 13.7% to 64.2% | 0.359 |
| Oct Y-1 to Mar Y | 0.29 | 42.1% | 17.2% to 66.3% | 0.347 |
Across the windows, El Niño accounts for roughly 33% to 42% of the scatter around the trend. As a share of total growth variance, it adds 13% to 16%. The intervals are wide. I would say "about a third to two fifths, with a 95% interval of about 11% to 66%".
The same-year window explains almost nothing. A lag of a few months is clearly better. The ocean warms first. The extra CO2 shows up in the air after that.
Result 4: the four years are not random
All 4 flagged years followed a Niño 3.4 average of at least +0.5 °C over October of the prior year to March. In all 56 years, 17 meet that condition (30.4%). The mean Niño 3.4 over the flagged years is +1.92 °C. Over all years it is -0.09 °C.
The permutation test gives a one-sided p of about 0.00005. That is the smallest value the test can report. The July to June window gives the same result (+1.40 °C against -0.07 °C).
Four events is a small sample. The test supports "not random". It does not give a precise effect size.
The reverse does not hold. Eight years had a prior October to March Niño 3.4 of at least +1.0 °C. Only 4 were flagged. The others were 1983, 1987, 1992 and 2010. Their excess was +0.27, +0.14, -0.72 and +0.55 ppm per year. So El Niño is close to necessary in this record, but it is not sufficient. The years 1983 and 1992 followed large volcanic eruptions (El Chichón and Pinatubo). That is my hypothesis. I did not test it.
A rule for when a jump is noise
For this proxy series, a jump is inside the normal scatter if it is less than about 0.9 ppm per year above the previous 10-year mean. That is 2 × 0.45 ppm per year, and the residual sd interval is 0.36 to 0.52. Jumps above that level happened in about 7% of years (2% to 17%). Each one followed a moderate to strong El Niño. A jump after a neutral or La Niña winter would be outside anything in this record.
I do not like the word "trend" for one year. A trend needs a baseline and a unit. A single year that follows an El Niño has both a known cause and a known size in this record.
Limits
- Proxy growth. Official NOAA values may differ and may change which years are flagged.
- Inferred column. I assigned the Niño 3.4 column by matching known events, not from a header.
- Residual sd. I computed it on the full-sample fit, so it includes the record years. This makes the rule somewhat conservative.
- Sample size. The 10-year baseline leaves only 56 testable years and 4 events.
- Bootstrap. The pairs bootstrap ignores serial dependence. Residual autocorrelation is about zero and the block bootstrap gives similar intervals.
- One index. Niño 3.4 is a single measure of ENSO. I did not model volcanoes or fires.
- No forecast. The Niño 3.4 value for September 2026 is +2.82 °C in the file I read. I make no prediction for 2027 here.
Next steps
The first check is to run the same rule on the official NOAA growth file, if an allowed host becomes available. The second is to confirm the Niño 3.4 column against a headed ONI file. Scripts are /work/scripts/analyze.py and /work/scripts/extra.py. Results are in /work/out/results.json.
The measurement says: in this proxy of the Mauna Loa record, a record CO2 jump is a 1-in-14 event (2% to 17%), and all four so far followed an El Niño winter. One such year is not a new trend.