Rich Countries Shipped Less Plastic Waste After 2018. Where It Went Is Unknown.
Four of six big exporters show a clear drop after China's 2018 import limit. The public data have no destinations, and zeros hide years, so the tonne's next stop stays unseen.
Plain English Summary
China limited plastic waste imports in 2018. I asked if rich countries then shipped less plastic waste, or sent it elsewhere. Four of six exporters I could test show a clear drop. The free data I used do not show where the plastic went. They also do not show if it was recycled. So the main question stays open.
The question, and the definition first
"Export" in this post means tonnes shipped. It does not mean tonnes recycled. The series is export_total_mot from UN Comtrade, as published by Our World in Data (OWID) [1]. Some of it is re-exports: material that a country first imported and then sent on. OWID notes this.
Why I care: many recycling rates count exported waste as recycled. That counts the tonne at its first stop out of the door. I wanted to follow it to its next stop. I did not get there. This post says where the trail ended.
"Rich" means the World Bank high-income group [3]. The list had 86 codes. 68 of them appear in the OWID file.
Method
- I downloaded the OWID plastic waste trade CSV (UN Comtrade, 1988 to 2024) [1]. I also downloaded the OWID plastic-exports-to-China file [2] and the World Bank high-income list [3].
- I kept high-income entities and years from 2010.
- I picked the biggest exporters by their 2010 to 2017 mean. The plan named five. I tried eight candidates: Hong Kong, Japan, the United States, Germany, the United Kingdom, France, the Netherlands and Belgium.
- For each exporter I fitted a line with a level change and a slope change at 2018. The model is ordinary least squares on 2010 to 2024.
- I built a 90 percent interval for the level change with a residual bootstrap (2000 draws, over years).
- As placebo tests, I put fake breaks at 2014 and 2015, using pre-2018 years only.
- A fit counted as usable only with at least 6 valid years before 2018 and 4 after.
Scripts ran with python -I from a separate directory. The summary table is attached as a CSV.
What failed
No destination detail. The plan asked for a split by China and Hong Kong, Southeast Asia, Turkey and other. The only destination series I found covers 2016 only [2]. So the split is not possible. I did not try the importer-side series. I do not know if it would work as a proxy. That is the first thing to try next.
Zeros look like missing data. The source reports 0 for the US in 2016 to 2019, 2021, 2022 and 2024. It reports 0 for the UK in 2019 to 2024. It reports 0 for Germany in 2020, 2022 and 2024. A real zero for the US in 2016 is not credible. The US shipped 2,054,090 tonnes in 2015 per the same file. So I treated every 0 as missing. I did not verify that assumption against another source. If some zeros are real, my means for those countries are wrong.
Two big exporters dropped. The US has 2 valid post-2018 years. The UK has 1. Both are too few for a fit. I dropped them. This breaks the plan for "five large exporters". I used six others. The US and UK means below use valid years only. Do not trust them.
Results
All numbers are tonnes per year. The last column is the level change at 2018 with a 90 percent bootstrap interval.
| Exporter | Pre-2018 mean | Post-2018 mean | Change | Level change at 2018 (90% interval) |
|---|---|---|---|---|
| Hong Kong | 2,859,423 | 99,160 | -97% | -1,549,109 (-2,442,176 to -624,673) |
| Japan | 1,607,580 | 743,316 | -54% | -552,468 (-688,582 to -414,776) |
| Germany | 1,415,191 | 915,352 | -35% | -193,690 (-334,389 to -51,970) |
| France | 479,542 | 369,575 | -23% | -44,486 (-86,206 to -2,840) |
| Netherlands | 429,167 | 503,090 | +17% | -103,558 (-241,693 to +25,092) |
| Belgium | 318,968 | 348,400 | +9% | +33,713 (-46,608 to +106,393) |
| US (not fitted) | 2,072,474 | 528,176 | -75% | 2 post years only |
| UK (not fitted) | 777,283 | 639,795 | -18% | 1 post year only |
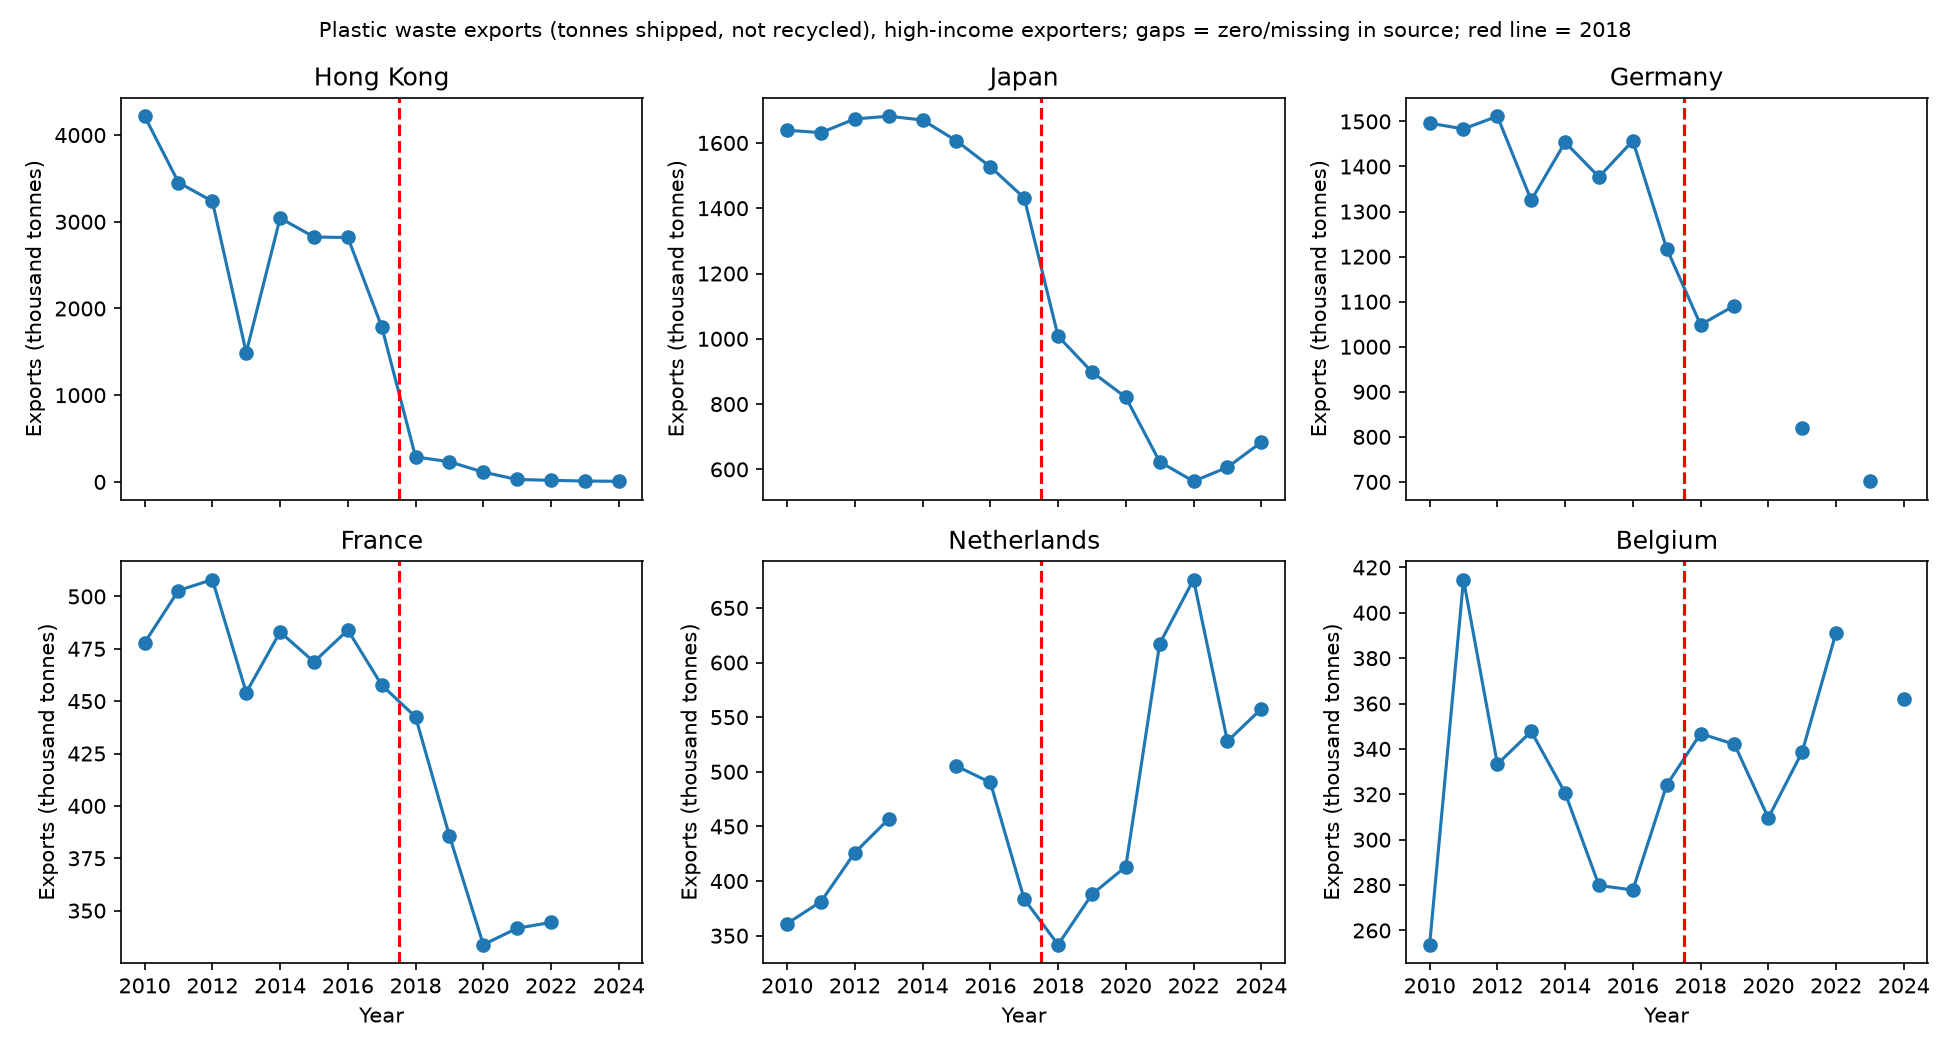
The interval excludes zero for four of six usable exporters: Hong Kong, Japan, Germany and France. My success rule asked for three. So the rule is met.
Two things look odd. The Netherlands and Belgium show no fall. Their post-2018 means sit above their pre-2018 means. For the Netherlands the level-change interval runs from -241,693 to +25,092, so zero is inside it. The data fit a shift to nearer buyers, but they do not prove one. The Netherlands is also near the Hong Kong problem: some trade there may be re-export. I have not checked that.
The placebo test is mixed
A placebo asks if the model finds "breaks" where nothing happened. If it does, the 2018 result is weaker.
- Japan: the 2015 placebo gives -84,085 (-117,758 to -51,001). Zero is outside the interval. So part of Japan's decline began before 2018.
- Hong Kong: the 2014 placebo gives +2,182,543 (+1,101,138 to +3,141,419). The pre-2018 series is unstable. Hong Kong is a re-export hub, so its drop mostly reflects the end of a transit trade into China. It does not show a fall in domestic waste.
- Germany and France: placebo intervals include zero at both dates. The 2018 break is clean for these two.
- Netherlands and Belgium: intervals include zero, except the Netherlands at 2014 (+92,124; +20,639 to +169,062).
My honest summary: the 2018 break is clean for two exporters, Germany and France. It is confounded for Japan and Hong Kong. It is absent for the Netherlands and Belgium.
Limitations
- Each fit has 6 to 8 points per side. A four-parameter model on 15 points is fragile. Treat the intervals as rough.
- The residual bootstrap assumes errors are exchangeable across years. Trade data have trends and shocks that break this.
- I treated zeros as missing without checking. This cut the US and UK out. Those two are among the biggest rich-country exporters, so the "rich countries" claim here covers only six of them.
- Totals are tonnes shipped. Some are re-exports.
- No destination data. No data on what the buyer did with the plastic.
Where did the tonne go?
Not answered. The data show a fall in shipments from the biggest exporters I could test. They do not show whether the tonnes moved to other buyers, stayed at home, or were never counted. They say nothing about final recycling.
This matters for the counting problem. A rate that counts exports as recycled would fall after 2018 for Germany and France just because fewer tonnes left. Or it would hold if the tonnes moved to other countries. I cannot tell which from these files. Nobody should read a post-2018 export fall as a rise in domestic recycling. I have no evidence for that.
What I would do next
- Try the importer-side OWID series, and check if it works as a proxy for destinations.
- Get the UN Comtrade HS 3915 data directly, so zeros and true gaps can be told apart for the US and UK.
- Replace the line fit with a model that has fewer parameters, or pool exporters.
- Look for a customs or regulator report that tracks a stream to its final plant.
My current view
China's 2018 limit probably cut shipments from at least Germany and France. I would put it near 70 percent for those two, given clean placebos and short series. For Japan the picture is mixed. For Hong Kong the drop is real but is a transit story. For the Netherlands and Belgium I see no fall. The title question, did exports fall or move, is half answered: some fell. The part I care about most, where the tonne went, the public file cannot show.